Project Nr. 1: Objective measures of motor dysfunction after compression spinal cord injury in adult rats: Correlations with locomotor rating scores
Participants: Katharina Wellmann, Janina Ankerne, Gregor Stein, Srebrina K. Angelova, Konrad Mader, Oliver Semler, Maria Grosheva, Sandra Maier, Eckhard Schönau, Andrey Irintchev, Doychin N. Angelov
Precise assessment of motor deficits after traumatic spinal cord injury (SCI) in rodents is crucial for understanding the mechanisms of functional recovery and testing therapeutic approaches. Here we analyzed the applicability to a rat SCI model of an objective approach, the single-frame motion analysis, created and used for functional analysis in mice. Adult female Wistar rats were subjected to graded compression of the spinal cord (Fig. 1). Recovery of locomotion was analyzed using video recordings of beam walking (Fig. 2) and inclined ladder climbing (Fig. 3). Three out of 4 parameters used in mice appeared suitable: the foot-stepping angle (FSA) and the rump-height index (RHI) measured during beam walking and estimating paw placement and body weight support, respectively, and the number of correct ladder steps (CLS) assessing skilled limb movements. These parameters, similar to the Basso, Beattie and Bresnahan (BBB) locomotor rating scores, correlated with lesion volume and showed significant differences between moderately and severely injured rats at 1-9 weeks after SCI (Figs. 4, 5). The beam parameters, but not CLS, correlated well with the BBB scores within ranges of poor and good locomotor abilities (Fig. 6). FSA co-varied with RHI only in the severely impaired rats while RHI and CLS were barely correlated (Fig. 7). Our findings suggest that the numerical parameters estimate, as intended by design, predominantly different aspects of locomotion. The use of these objective measures combined with BBB rating provides a time- and cost-efficient opportunity for versatile and reliable functional evaluations in both severely and moderately impaired rats combining clinical assessment with precise numerical measures.
1 /
7
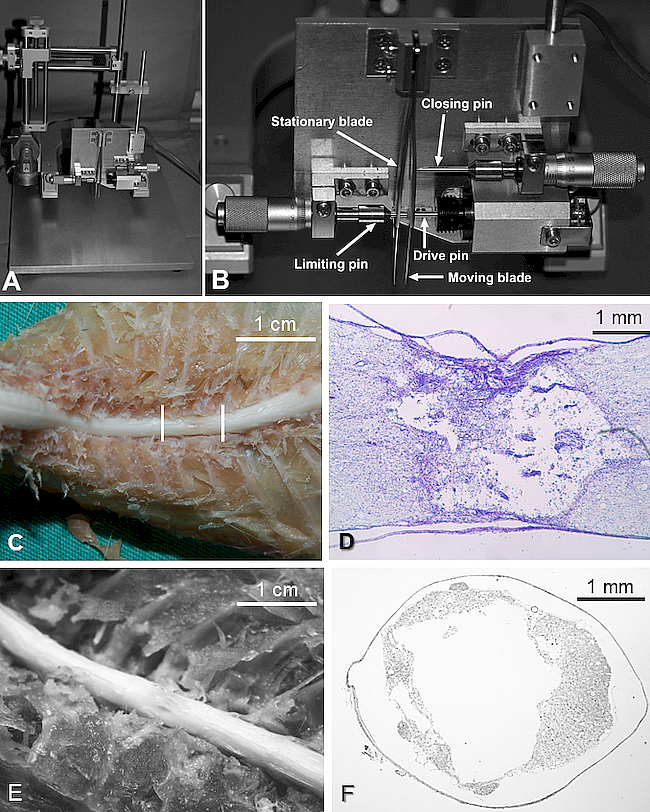
Figure 1. The self-made spinal cord compression device after Curtis et al. (1993). (A) A stereotaxic frame with the device mounted on a metal plate. (B) Driven by timed current, the drive pin of an electromagnet closes the forceps by pressing the moving blade of the forceps. Total closure is prevented by a limiting pin, which passes through a hole drilled in the stationary blade. The calibrating screw of the limiting pin allows determining the degree of closure of the forceps as percentage of the spinal cord diameter. The calibrating screw of the closing pin is be used to manually advance the moving blade and thus adapt the tips of the forceps to the surface of the spinal cord and measure its diameter.
Figure 2. Beam walking analysis. (A) Experimental setup. Shown is a rat 1 week after severe SCI walking on the platform towards its home cage. (B,C) A non-injured rat (B) and a rat 1 week after severe SCI (C) during beam walking. The foot-stepping angle (FSA) for the left paws and the distances a (rump height) and b (beam width) used for calculation of the rump-height index (RHI = a / b) are drawn in the panels.
Figure 3. Ladder climbing test. (A) The inclined ladder. (B-F) Single frames of video sequences recorded during ladder climbing of two rats tested 1 week (B,C) and 9 weeks (D-F) after moderate SCI. At 1 week, the animal is moving up using its forepaws (note position of the trunk in C versus B). The hindlimbs are hanging in front of or behind the rungs and do not support climbing. At 9 weeks, the animal has correctly placed its left paw on a rung (arrows in D-F) and this position is maintained while the trunk and the right limb are moving up.
Figure 4. Time course and degree of functional recovery after severe and moderate SCI. Shown are mean values ± SEM (N = 11 per group) of locomotor rating scores (BBB, A) , foot-stepping angles (FSA, B), rump-height indices (RHI, C) and numbers of correct ladder steps (CLS, D) prior to surgery (0 weeks) and at 1, 3, 6 and 9 weeks after injury. For all parameters, two-way repeated measures ANOVA with injury as between-subject factor and time as within-subject factor revealed significant effects of injury (moderate versus severe, F1,20 = 77, 153, 53 and 10 for A-D, respectively, p < 0.001 for A-C, p < 0.004 for D) and time (F4,80 = 335, 183, 97 and 290, p < 0.001 for all), as well as significant interactions between the two factors (F4,80 = 32, 75, 15 and 6.0, p < 0.001). Within-group post-hoc comparisons (Tukey’s test) showed: (1) significant differences (p < 0.05) between all pre-operative values (0 weeks) and the respective values at 1 week, (2) significant differences between 9 and 0 weeks (cross-hatches) except for “FSA Moderate” (B), and (3) different time points of maximum recovery (arrows), i.e. time points at which the values were different from 1 week but similar to later time points. Note lack of recovery for CLS after severe injury (D). Between-group comparisons revealed significant differences at all post-operative time points (asterisks) except for correct steps at 1 week (D).
Figure 5. Correlations between functional parameters and lesion volume 9 weeks after SCI. Lesion volume was estimated from spaced-serial sections (A) using the Cavalieri principle. (A) A 25-µm longitudinal section of a rat spinal cord dissected 9 weeks after severe SCI. Cresyl violet staining, scale bar = 200 µm. Note fluid-filled cavities occupying most of the area at the lesion site. (B-E) Scatter plots of individual values (N = 8 per group) with regression lines and coefficients of determination (r2) calculated by regression analysis. The ANOVA probability values were p < 0.0001 (B,C) , p = 0.002 (D,E) . BBB - locomotor rating scores; FSA - foot-stepping angles; RHI - rump-height indices; CLS - correct ladder steps.
Figure 6. Correlations between functional parameters 9 weeks after SCI. Scatter plots of individual values (N = 11 per group) with coefficients of correlation (r at the x-axes) calculated for all values (Severe + Moderate). The numbers adjacent to groups of solid and open symbols indicate correlation coefficients calculated separately for severely and moderately injured rats, respectively. Shown are also regression lines for the whole population, for severely injured and for moderately injured rats (dotted, dashed and solid lines, respectively). Asterisks indicate: # - p < 0.10, * - p < 0.05, ** - p < 0.01, *** - p < 0.001. The preoperative values (Non-injured) of the rats in the moderate injury group are plotted as reference for normal values and were not included in the correlation analyses. FSA - foot-stepping angles; RHI - rump-height indices; CLS - correct ladder steps.
Figure 7. Comparisons of parameters using recovery indices. (A) Calculation of the recovery index (RI). FSA values of a moderately injured rat are plotted against time after injury. The RI at, for example, 6 weeks is calculated as “gain” of function after the 1st week (dashed vertical line) normalized to “loss” of function between 0 and 1 week (solid vertical line), i.e. [(Y6 –Y1)/(Y0 – Y1)] x 100. (B,C) Mean ± SEM of RI calculated for each parameter at 3, 6 and 9 weeks after moderate (B) and severe SCI (C). Multiple comparisons showed significant differences between all pairs of parameters at a given time point in B (ANOVA F3,40 = 74 to 127, p < 0.001, Tukey’s test p < 0.05) and differences for CLS versus RHI at 6 and 9 weeks and CLS versus FSA at 9 weeks in C (F3,40 = 2.9 and 4.4, p < 0.05). (D,E) Individual BBB scores at 9 weeks plotted against individual averaged RI calculated using FSA and RHI (Beam RI, D) and FSA, RHI and CLS (Beam & CLS RI, E). Shown are also linear regression lines (dashed lines) and correlation coefficients (r, *** - p < 0.001). The solid line in each graph is the ideal correlation line connecting the points at which the two parameters have their lowest and highest possible values (score 0 versus RI 0% and score 21 versus RI 100%).
Project Nr. 2: Functional deficits and morphological changes in the neurogenic bladder match the severity of spinal cord compression
Participants: Ozlem Ozsoy, Umut Ozsoy U, Gregor Stein, Oliver Semler, Emmanouil Skouras, Greta Schempf, Katharina Wellmann, Felicitas Wirth, Srebrina Angelova, Janina Ankerne, Mahak Ashrafi, Eckhard Schönau, Teodora Papamitsou-Sidoropolou, Patrick Jaminet, Levent Sarikcioglu, Andrey Irintchev, Sarah A. Dunlop, Doychin N. Angelov
Following spinal cord injury (SCI), loss of spinal and supraspinal control results in desynchronisation of detrusor vesicae (parasympathicus) and external urethral sphincter (sympathicus) activity. Despite recovery of lower urinary tract function being a high priority in patients with SCI, effective treatment options are unavailable largely because mechanisms are poorly understood (Fig. 8). We used a clinically relevant model of thoracic SCI compression injury in adult female Wistar rats and confirmed that lesion volumes following severe injuries were significantly greater compared to moderate injuries (Figs. 10, 11). Between 1-9 weeks, we assessed recovery of bladder function as well as return of locomotor function using the Basso, Beattie and Bresnahan (BBB) score (Fig. 9). Bladder morphometrics and overall intramural innervation patterns, as assessed with ß-III tubulin immunohistochemistry, were also examined (Figs. 12-14). Despite variability, bladder function was significantly worse following severe compared to moderate compression injury (p<0.05); furthermore, the degree of bladder and locomotor dysfunction were significantly correlated (r=0.59; p<0.05). In addition, at 9 weeks after SCI we saw significantly greater increases in bladder dry weight (p<0.05) and wall thickness following severe compared to moderate injury as well as increases in intramural axon density (moderate: 3x normal values; severe 5x; both p<0.05) that also correlated with injury severity (r=0.89; Fig. 15). The moderate and severe compression models show consistent and correlated deficits in bladder and locomotor function, as well as in gross anatomical and histopathological changes. Increased intramural innervation may contribute to neurogenic detrusor overactivity and suggests the use of therapeutic agents which block visceromotoric efferents.
1 /
8
Figure 8. Diagram showing neural circuits controlling continence and micturition, i.e. the direct (spinal) innervation of LUT. Blue lines represent afferent/sensory pathways to the region indicated by the arrows. Red lines represent efferent/motor projections to the region marked by the arrows. Circles with a (+) indicate muscle contraction and circles with a (-) indicate muscle relaxation. Lesioned pathways by the spinal cord compression are indicated by X. During filling (Filling bladder), low level firing from the bladder stimulates the sympathetic outflow from the intermediolateral gray matter (IML, region 2) to the detrusor muscles in the bladder wall (circle), to the internal sphincter as well as impulses to the sacral ventral horn (region 7) providing pudendal outflow to the external urethral sphincter. During storage of urine (Full bladder), distension of the bladder wall produces afferent firing to the spinal cord gray substance (region 4) and to the Gert´s nucleus (region 10) which in turn stimulates the core of the periaqueductal gray matter (PAG, region 5). The latter stimulates the pontine micturition center (PMC, region 6) provided a "permission" by the limbic system (region 8) has been granted. During elimination of urine (Voiding bladder) PMC stimulates the parasympathetic outflow to the sacral parasympathetic nucleus (SPN, region 1) and to the Onuf´s nucleus (region 3). SPN in turn inhibits the sympathetic flow to the internal sphincter (urethral outlet) and directly stimulates the detrusor. PMC also inhibits (i.e. relaxes) the external sphincter via the sacral IMM (region 9) and Onuf´s nucleus (region 3). LUT innervation can be summarized as follows: Parasympathetic nerves. Parasympathetic pathways to the urethral wall induce relaxation during voiding. The major excitatory input to the bladder is provided by the sacral efferent pathway which consists of spinal preganglionic neurons whose cell bodies lie in the gray matter of the caudal lumbar and rostral sacral spinal segments (sacral parasympathetic nucleus, SPN; region 1). The SPN sends axons (via nn. splanchnici pelvici) to peripheral ganglion cells that, in turn, innervate the bladder and urethral smooth muscle (i.e. internal sphincter). Sympathetic nerves. Pregangionic pathways arise from the spinal segments T11 to L2 (intermediolateral gray matter, region 2 lamina X and laminae V-VII; region 4). They project to the sympathetic chain ganglia and then to the prevertebral ganglia in the superior hypogastric plexus. Postgangionic nerves provide excitatory input to the smooth muscles of the internal urethral sphincter and inhibitory input to the detrusor muscles. Somatic (sensory-motor) LUT innervation is summarized as follows: Afferent/sensory innervation of LUT occurs via three sets of nerves: 1) Afferent pathways from LUT project to discrete regions of the dorsal horn which comprises interneurons and somata and/or dendrites of efferent neurons innervating LUT. In cat and rat, pelvic nerve afferents from the urinary bladder project to the apex of the dorsal horn (Lissauer´s tract; region 4). They then pass rostrocaudally giving off collaterals laterally and medially to the dorsal horn (lamina I) and deeper layers (laminae V-VII and X). The lateral pathway is the most prominent, terminates in SPN (region 1) and also sends some axons to the dorsal commissure. 2) Pudendal afferents from the urethra and urethral sphincter exhibit a similar pattern of termination in the sacral spinal cord. In cat, ascending afferents from the spinal cord project to a relay station in the periaqueductal gray (PAG; region 5), which then connects to PMC; region 6). 3) Afferents that initiate micturition pass through the pelvic nerve to the sacral spinal cord. They comprise small myelinated (A?) and unmyelinated C-fibers that convey information about bladder wall tension and volume as well as noxious stimuli from receptors in the bladder wall to second order neurons in the spinal cord. Efferent/motoric innervation. The external urethral sphincter (EUS) consists of striated muscle fibers. They are innervated by the pudendal nerve, the axons of which emerge from motoneurons in the sacral ventral horn (region 7). Additional pudendal motoneurons are located in the ventrolateral division of Onuf´s nucleus; region 3). These motoneurons send dendritic projections into the lateral funiculus, Lamina X, intermediolateral gray matter and rostrocaudally within the nucleus.
Figure 9. Recovery of locomotor and bladder function after severe and moderate SCI. Shown are mean values + SEM of BBB (A) and bladder scores (B) prior to SCI (0 weeks) and 1, 3, 6 and 12 weeks after injury. For both parameters, two-way repeated measures ANOVA with injury as between-subject factor and time as within-subject factor revealed significant effects of injury (moderate versus severe, F1,18 = 54 and 14, p < 0.001 and 0.003 for A and B, respectively) and time (F9,80 = 338 and 96, p < 0.001 for A and B), as well as significant interactions between the two factors (F9,80 = 29 and 4.4, p < 0.001 and 0.004 for A and B, respectively). Within-group post-hoc comparisons (Tukey’s test) showed: (1) significant differences (p < 0.05) between the pre-operative values (0 weeks) and the respective values at 1 week, (2) significant differences between 9 and 0 weeks (cross-hatches), and (3) different time points of maximum recovery (arrows), i.e. time points at which the values were different from 1 week but similar to later time points. Note lack of recovery for the bladder score after severe injury (B). Between-group comparisons revealed significant differences at all post-operative time points (asterisks) except for bladder score at 1 week (B).
Figure 10. The lesioned portion of the spinal cord between vertebrae T7-T9 following moderate (A) and severe (C) spinal cord compression. Following Cresyl violet staining of 25-µm longitudinal cryosections (B, D), lesion volume was estimated from spaced-serial sections using the Cavalieri principle. Note the more extensive cavitation severely (D) compared to moderately (B) injured rats. Scale bar = 200 µm.
Figure 11. Cresyl violet stained cross-sections (25 µm) from 3 different spinal cord levels at 9 weeks after moderate (A-C) and severe (D-F) compression. The difference in the amount of preserved white matter especially at the compression level (T8-T9) and below it (T10-T11) is obvious.
Figure 12. Bladder hypertrophy 9 weeks after SCI. (A) Macroscopic appearance of bladders dissected from intact (I), moderately injured (M) and severely injured (S) rats. Scale bar = 10 mm. (B) Mean bladder wet weights + SEM. One-way ANOVA revealed significant effects of treatment (F2,25 = 16, p < 0.001). Asterisks indicate values significantly different from intact animals (Holm-Sidak post-hoc test).
Figure 13. Bladder hypertrophy and bladder innervation at 9 weeks after SCI. Histological appearance after HE-staining of sagittal sections through the bladders of representative intact (A), moderately injured (D) and severely injured (G) rats. Low (B, E, H) and high power (C, F, I) pictures of immunostained axons (rabbit anti-neurotubulin plus Cy3 conjugated anti-rabbit IgG) in tissue sections adjacent to sections in A, D and G, respectively. Arrows in B, E and H point to sites with whorls of axons, which were photographed in C, F and I at higher magnification.
Figure 14. Increased innervation of hypertrophic bladders 9 weeks after SCI. (A) Mean density of ß-tubulin-positive pixels (+ SEM) in intact, moderately and severely injured rats. One-way ANOVA revealed significant effects of treatment (F2,25 = 22, p < 0.001). Asterisks indicate values significantly different from intact animals (Holm-Sidak post-hoc test). (B) Scatter plot showing the co-variation between ß-tubulin pixel density and bladder weight. Each symbol represents an individual animal. Shown also are the linear regression line, correlation coefficient (r) and probability value (p).
Figure 15. Correlations between functional and structural parameters 9 weeks after SCI. Scatter plots of individual values with coefficients of correlation (r at the x-axes) calculated for all values (Severe + Moderate) and regression lines. Asterisks indicate: * - p < 0.05, ** - p < 0.01, *** - p < 0.001.
Projekt Nr. 3: Whole-body vibration improves functional recovery in spinal cord-injured rats
Participants: Felicitas Wirth, Greta Schempf, Gregor Stein, Katharina Wellmann, Marilena Manthou, Maina Sidorenko, Oliver Semler, Leonie Eisel, Rachida Harrach, Srebrina Angelova, Patrick Jaminet, Janina Ankerne, Mahak Ashrafi, Ozlem Ozsoy, Umut Ozsoy U, Harald Schubert, Diana Abdulla, Sarah A. Dunlop, Andrey Irintchev, Eckhard Schönau, Doychin N. Angelov
Whole-body vibration (WBV) is a relatively novel form of exercise used to improve neuromuscular performance in healthy individuals. Its usefulness as a therapy for patients with neurological disorders, in particular spinal cord injury (SCI), has received little attention in clinical settings and, surprisingly, even less in animal SCI models. We performed severe compression SCI at a low-thoracic level in Wistar rats followed by daily WBV (Fig. 16) starting 7 (10 rats) or 14 (10 rats) days after injury (WBV7 and WBV14, respectively) and continued over a 12-week post-injury period. Rats with SCI but no WBV training (sham, 10 rats) and intact animals (10 rats) served as controls. Compared to sham treated rats, WBV did not improve BBB score, plantar stepping or ladder stepping during the 12-week period (Fig. 17). Accordingly, WBV did not significantly alter plantar H-reflex (Fig. 18), lesion volume (Fig. 19), serotonergic input to the lumbar spinal cord (Fig. 20) nor cholinergic (Fig. 21) or glutamatergic (Fig. 22) inputs to lumbar motoneurons at 12 weeks after SCI. However, compared to sham, WBV14, but not WBV7, significantly improved body weight support (rump-height index) during ground locomotion and overall recovery between 6 - 12 weeks and also restored the density of synaptic terminals in the lumbar spinal cord at 12 week (Fig. 23). Most remarkably, WBV14 lead to a significant improvement of bladder function at 6 - 12 weeks after injury (Fig. 24). These findings provide the first evidence for functional benefits of WBV in an animal SCI model and warrant further preclinical investigations to determine mechanisms underpinning this non-invasive, inexpensive and easily delivered potential rehabilitation therapy for SCI.
1 /
9
Figure 16. Setup of the rat Galileo-device for whole-body vibration (WBV) training. During conditioning (A), intact rats received WBV at 15 Hz for 5 minutes daily. WBV therapy (B) started at 7 or 14 days after SCI and consisted of 5 sequential trials of vibrations at 15 Hz and 30 Hz (see text for more details).
Figure 17. Time course and degree of functional recovery in rats with spinal cord injury (SCI) subjected to WBV from day 7 or 14 on (WBV7 and WBV14, N = 8 and 9, respectively) or no WBV (Sham, N = 8). Shown are mean values ± standard errors of mean (SEM) of locomotor rating scores (Basso, Beattie, and Bresnahan [BBB]; A), foot-stepping angles (B), rump-height indices (C), numbers of correct ladder steps (D) and overall recovery indices (E) calculated using data for the numerical parameters (panels B-D) prior to surgery (0 weeks), and at 1, 3, 6, 9 and 12 weeks after injury. For all parameters, two-way repeated-measures analysis of variance (ANOVA) with treatment as between-subject factor and time as within-subject factor revealed significant effects of time (p < 0.001) for all parameters (A-E). Treatment had no effect (p > 0.05) on the BBB scores (A), foot-stepping angles (B) and correct ladder steps (D) but its effects on the rump-height indices (C) and overall recovery indices (E) were significant (p = 0.040 and 0.026, respectively) and there was a significant interactions between treatment and time for the latter two parameters (p = 0.014 and < 0.001 for C and E, respectively). Within-group post-hoc comparisons (Holm-Sidak method) showed: (1) significant differences (p < 0.05) between all preoperative values (0 weeks) and the respective values at 1 week and (2) significant differences between 12 and 0 weeks. Between-group comparisons revealed no differences between the WBV7 and Sham groups for any parameter and time-point. The rump-height index and the overall recovery index in the WBV14 group of rats were significantly better compared with WBV7 and Sham animals at 6 – 12 weeks after injury (asterisks).
Figure 18. Plantar H-reflex 12 weeks after SCI. (A) Maximum M- and H-responses at 0.1-Hz stimulation and their ratios (H/M). Shown are mean values + SEM for sham-, WBV7 and WBV14-treated rats (N = 7, 8 and 7, respectively). No differences were found for any parameter (p > 0.05, one-way ANOVA). (B) Rate depression of the H-wave in the animals shown in panel A. Mean values ± SEM of stimulation frequencies of 0.1, 0.3, 0.5, 1, 3 and 5 Hz normalized to the amplitudes of the baseline stimulation frequency (0.1 Hz). Two-way repeated-measures ANOVA with treatment as between-subject factor and frequency as within-subject factor revealed significant effects of frequency (p < 0.001) but no effect of treatment (p = 0.131) and no interaction between treatment and time (p = 0.625). Within-group post-hoc comparisons (Holm-Sidak method) showed a significant frequency-dependent decline in the H-waves for all groups (p < 0.001 for 5 versus 0.1 Hz).
Figure 19. Lesion volume 12 weeks after SCI. Lesion volume was estimated from spaced-serial sections using the Cavalieri principle. (A) Shown is a 25-µm longitudinal section from a spinal cord of a sham animal (cresyl violet staining, scale bar = 250 µm). (B) Mean lesion volume (+ SEM) in sham-, WBV7 and WBV14-treated rats (N = 6, 6 and 7, respectively). No differences among the groups were found (p > 0.05, one-way ANOVA).
Figure 20. 5-HT axon densities in the lumbar spinal cord 12 weeks after SCI. (A) Immunofluorescence 5-HT staining in 25-µm transverse sections from the spinal cord (lamina IX) of an intact and a WBV14-treated rat (scale bar = 50 µm). (B) Mean number of 5-HT-positive pixels (+ SEM) in intact rats and sham-, WBV7- and WBV14-treated rats (N = 5, 5, 7 and 9, respectively). All groups with SCI were significantly different from intact animals (cross-hatch, p < 0.05, one-way ANOVA and Holm-Sidak test) but no differences among sham, WBV7 and WBV14 rats were found.
Figure 21. Frequencies of cholinergic perisomatic terminals and soma areas of lumbar motoneurons 12 week after SCI. (A) Immunofluorescence ChAT staining in a 25-µm transverse section from the spinal cord of a WBV7-treated rat. The larger panel shows the distribution of ChAT-positive neurons in the ventral horn of the spinal cord. Ventral is at the bottom of the image, lateral – on the right hand side. Scale bar = 400 µm). Insert: Motoneurons at higher magnification with ChAT-positive terminals on their cell bodies (some indicated by arrows, N – nuclei, scale bar = 50 µm). (B, C) Mean frequency (number per unit length) of ChAT-positive perisomatic terminals (B) and mean soma area of lumbar motoneurons (C) + SEM in intact rats and sham-, WBV7- and WBV14-treated rats (N = 5, 9, 8 and 9, respectively). For ChAT terminals, all groups with SCI were significantly different from intact animals (cross-hatch, p < 0.05, one-way ANOVA and Holm-Sidak test) but no differences among sham, WBV7 and WBV14 rats were found. Motoneuron soma area was similar in all groups (p > 0.05, one-way ANOVA).
Figure 22. Densities of VGLUT1-positive synaptic terminals in the lumbar spinal cord 12 week after SCI. (A) Immunofluorescence VGLUT1 staining in 25-µm transverse sections from the spinal cord (lamina IX) of an intact and a WBV14-treated rat (scale bar = 30 µm). (B, C) Mean number of VGLUT1-positive pixels in lamina IX (B) and Clarke`s column (C)(+ SEM) in intact rats and sham-, WBV7- and WBV14-treated rats (N = 6 for all groups). For both areas of the spinal cord, all groups with SCI were significantly different from intact animals (cross-hatch, p < 0.05, one-way ANOVA and Holm-Sidak test) but no differences among sham, WBV7 and WBV14 rats were found.
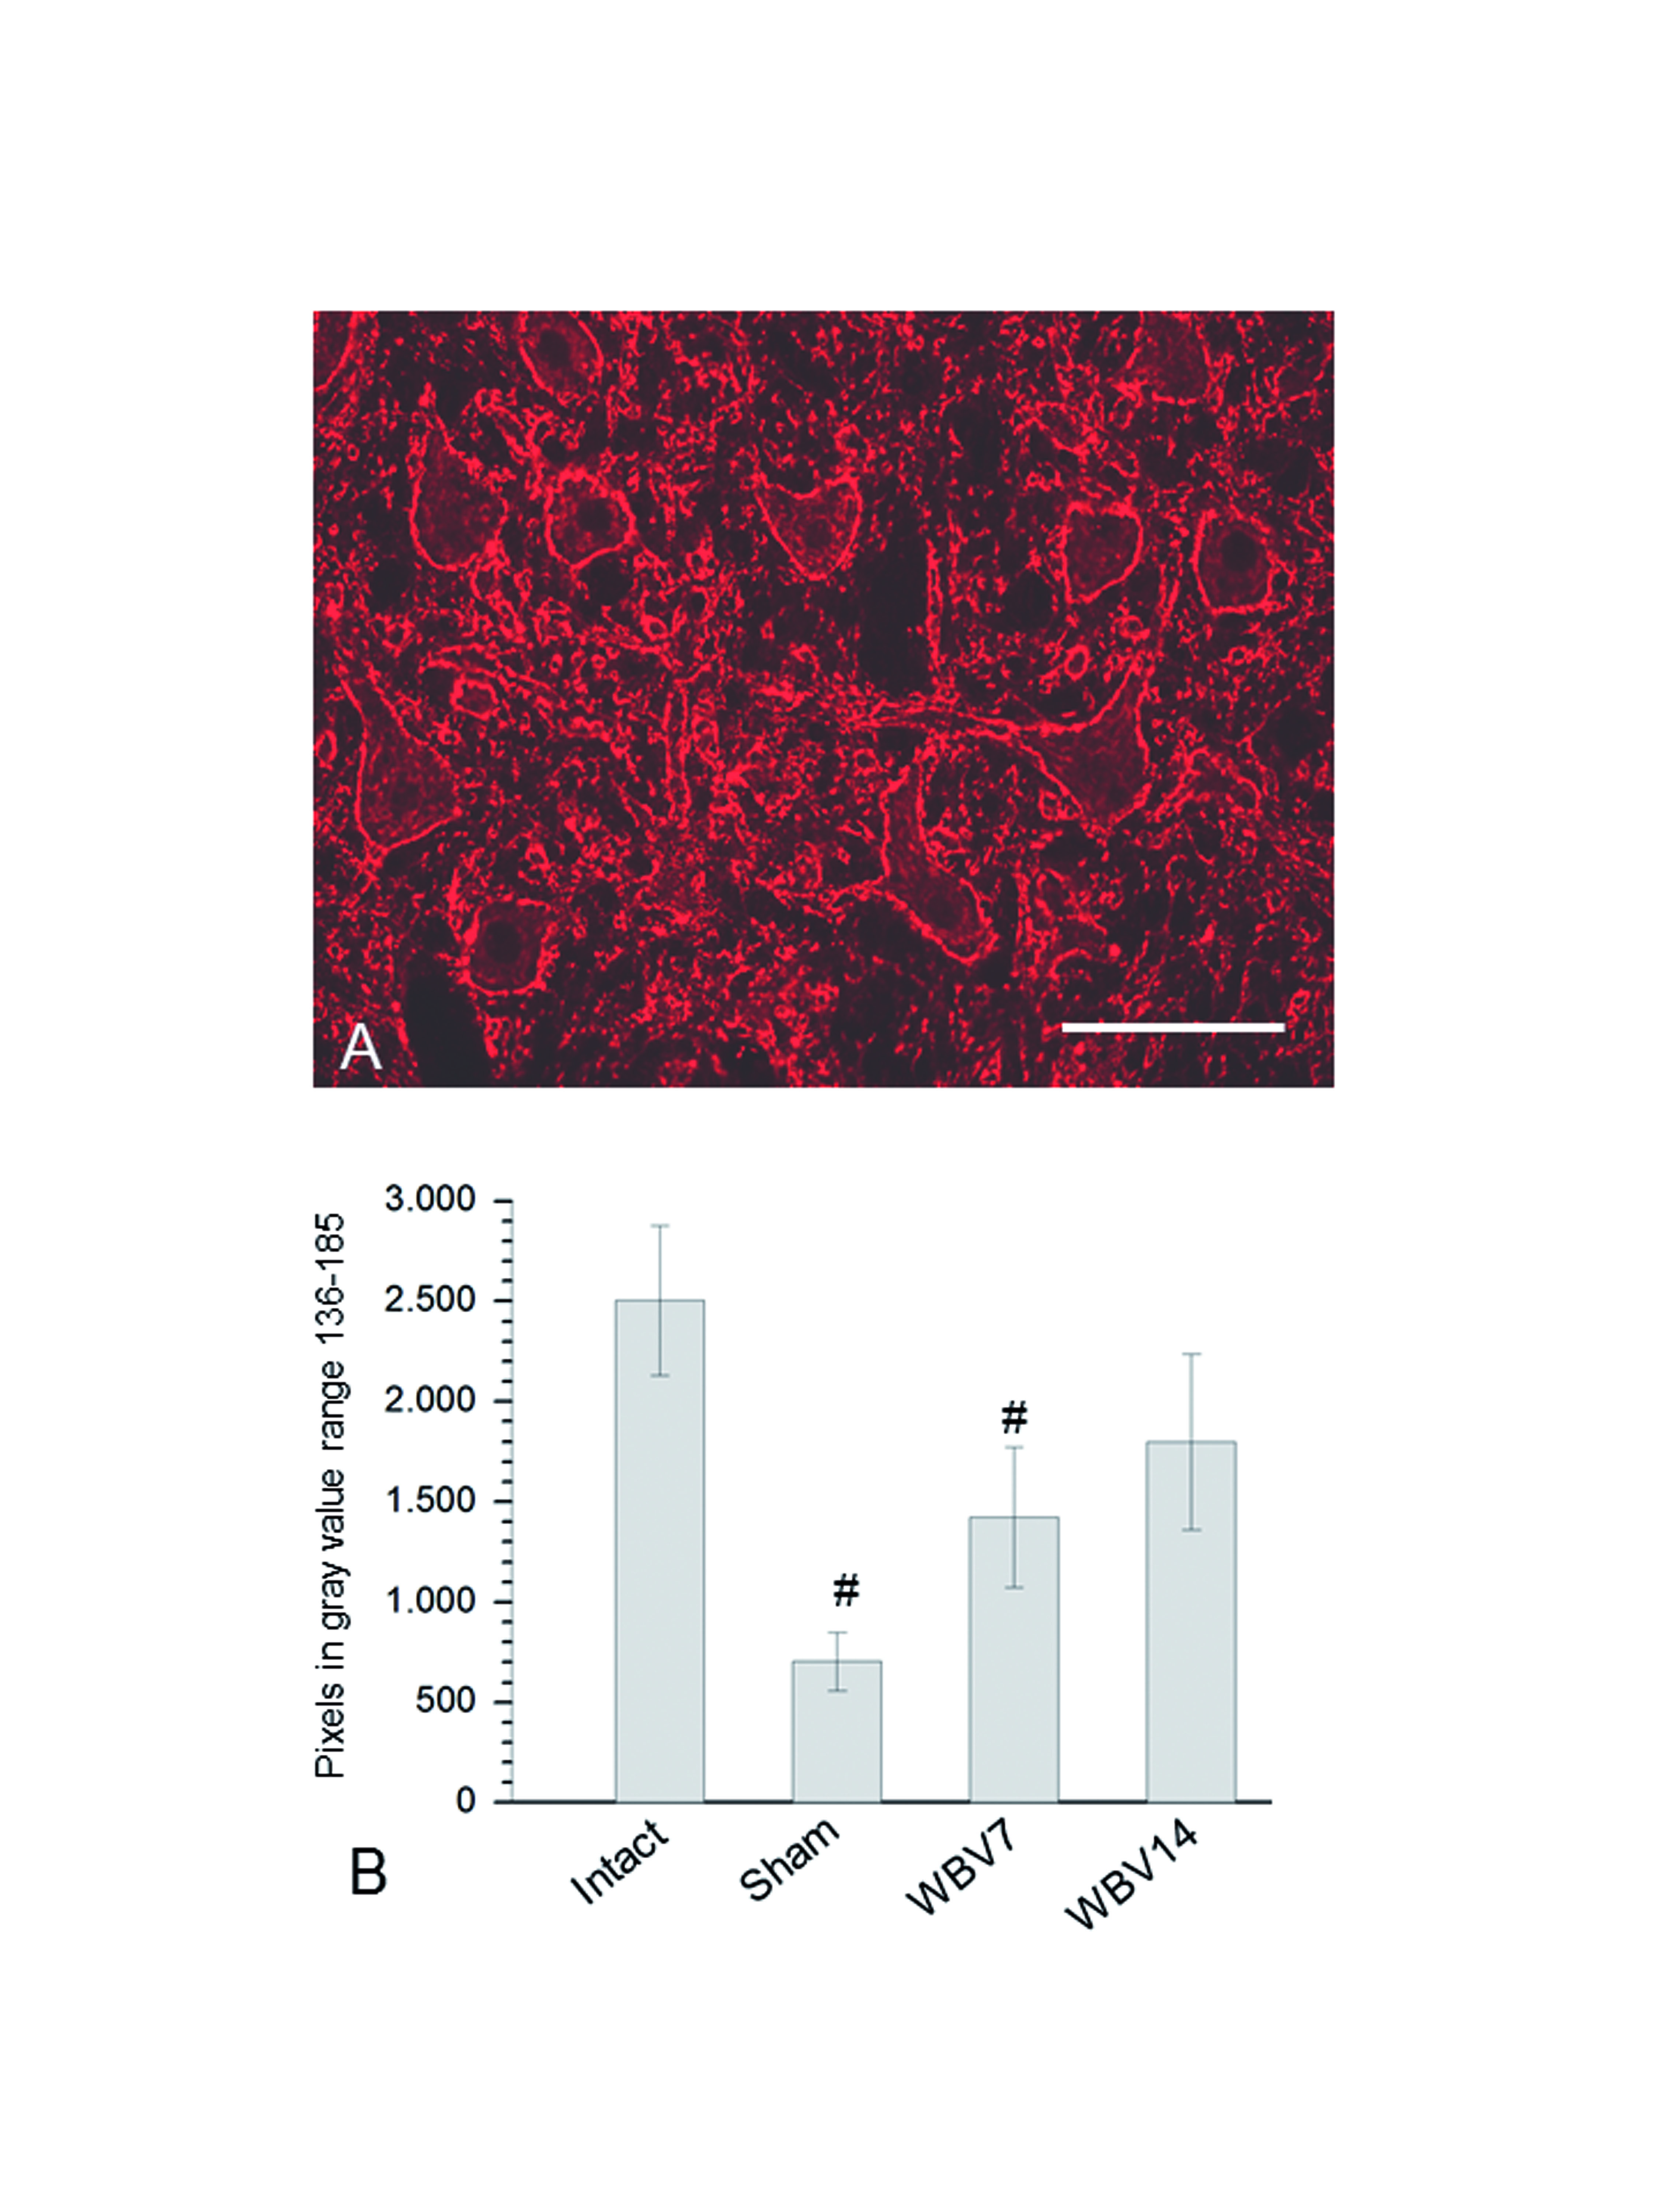
Figure 23. Synaptic terminals density in the lumbar spinal cord at 12 weeks after SCI. (A) Immunofluorescence staining for synaptophysin in 25-µm transverse sections from the spinal cord (lamina IX) of a WBV14-treated rat (scale bar = 100 µm). (B) Mean number of synaptophysin-positive pixels (+ SD) in intact rats and sham-, WBV7- and WBV14-treated rats (N = 5, 5, 7 and 9, respectively). Only the sham and WBV7 groups were significantly different from intact animals (cross-hatch, p < 0.05, one-way ANOVA and Holm-Sidak test).
Figure 24. Bladder function and bladder innervation. (A) Macroscopic appearance at 12 weeks after injury of bladders from an intact rat and sham-, WBV7- and WBV14-treated rats. Scale bar = 10 mm. (B) Immunofluorescence beta III-tubulin staining in sagittal section from an intact rats and WBV14-treated rat at 12 weeks after injury. Scale bar = 250 µm. (C) Mean bladder scores ± SEM in sham-, WBV7- and WBV14-treated rats (N = 8, 8 and 9, respectively) prior to injury (day 0) and 1, 3, 6, 9 and 12 weeks after SCI. Two-way repeated-measures analysis of variance (ANOVA) with treatment as between-subject factor and time as within-subject factor revealed significant effects of time (p < 0.001) and treatment (p = 0.004), as well as a significant interaction between the two factors (p = 0.010). Within-group post-hoc comparisons (Holm-Sidak method) showed: (1) significant differences (p < 0.05) between all preoperative values (0 weeks) and the respective values at 1 week and (2) significant improvement in WBV14, but not WBV7 and sham rats, between 0 and 3 weeks. Between-group comparisons revealed no differences between the WBV7 and sham groups at any time-point. The scores in the WBV14 group of rats were significantly better compared with WBV7 and sham animals at 6 – 12 weeks after injury (asterisks). (D, E) Bladder wet weights and axon densities 12 weeks after injury in the rats shown in panel C. Shown are mean values + SEM. For both parameters (D, E), all groups with SCI were significantly different from intact animals (cross-hatch, p < 0.05, one-way ANOVA and Holm-Sidak test) but no differences among sham, WBV7 and WBV14 rats were found.
Project Nr. 4: Functional recovery after experimental spinal cord compression and whole body vibration therapy requires a balanced revascularization of the injured site
Participants: Marilena Manthou, Klaus Nohroudi, Samantha Moscarino, Felix Rehberg, Gregor Stein, Ramona Jansen, Diana Abdulla, Patrick Jaminet, Oliver Semler, Eckhard Schoenau, Doychin N. Angelov
Based on several positive effects of whole-body-vibration (WBV) therapy on recovery after SCI, we looked for correlations between functional (analysis of locomotion), electrophysiological (H-reflex) and morphological (density of functioning capillaries) measurements after SCI and WBV-treatment. Severe compression SCI at low-thoracic level (T8) in adult female Wistar rats was followed by WBV twice a day (2 x WBV) over a 12-week post-injury period (Fig. 25). Intact rats and rats with SCI but no WBV-therapy ("No-WBV") served as controls. Recovery of locomotion was determined by BBB-locomotor rating, foot stepping angle (FSA), rump-height index (RHI), correct ladder steps (CLS) and H-reflex at 1, 3, 6, 9, and 12 weeks after SCI (Figs. 26, 27). Animals were sacrificed by an overdose of Isoflurane. One hour later their spinal cords were fixed in 4% PFA for 24 h. Samples from the thoracic cord containing the lesion site and from the lumbar intumescence were cut into 10 µm thick longitudinal frozen sections. All functioning capillaries were unequivocally identified because the endogenous peroxidase of the erythrocytes was clearly visualized with 0.05% diaminobenzidine (DAB; Fig. 28). A determination of their absolute (in µm2) and proportional areas (percent of photographed tissue) revealed a significantly denser capillary network in the WBV-treated rats: 1,66 ± 0,41% in the "vibrated" rats versus 0,79 ± 0,19% in the "No-WBV" animals. The portion of the capillary network in intact rats was 1,51 ± 0,69% (Fig. 29). Surprisingly, even though the vascularization in the treated animals was significantly increased, this had no beneficial influence on the recovery of functions after SCI. The results of this study provide for the first time evidence that intensive WBV-therapy leads to a significantly denser capillary network in the lesioned spinal cord. However, since this higher capillary density is not associated with improved functional recovery (possibly because it exceeded the balance necessary for functional improvements), optional treatments with lower intensity or less time of WBV-therapy should be tested.
1 /
5
Figure 25. The self-made spinal cord compression device after Curtis et al. (1993). (A) A stereotaxic frame with the device mounted on a metal plate. (B) Driven by timed current, the drive pin of an electromagnet closes the forceps by pressing the moving blade of the forceps. Total closure is prevented by a limiting pin, which passes through a hole drilled in the stationary blade. C: Vertebral column and spinal cord of an animal fixed by perfusion. The lesioned portion of the spinal cord between vertebrae T7-T9 and the L1-L3 segments of the lumbar cord are indicated by the vertical lines. Exactly these portions of the spinal cord were removed and cut in longitudinal sections. D: WBV therapy was performed two times daily. It started at 14 days after SCI and consisted of 5 sequential trials of vibrations at 15 Hz and 30 Hz (Adopted from Semler et al., 2011; see text for more details).
Figure 26. A: Locomotor functions were evaluated using the Basso, Beattie, Bresnahan (BBB) rating scale (Basso et al., 1995). Scoring was done by two independent investigators who watched video recordings at slow playback speed. Assessment was performed prior to injury (0 weeks) and 1, 3, 6, 9 and 12 weeks after SCI. B: Beam walking analysis of an intact rat. The foot-stepping angle (FSA) for the left hindpaw and the distances a (rump height) and b (beam width) used for calculation of the rump-height index (RHI = a / b) are drawn. C: A rat at 1 week after SCI walking on the platform towards its home cage. D: H-reflex recordings from the plantar musculature: Distribution and insertion of electrodes during measurement. (the cathode was red and always proximal; the anode was blue and always distal). A ground needle electrode (black) was applied at the base of the tail. During recording, a reference stainless steel electrode (green) was fixed to the skin between the first and second digit and an active recording electrode (yellow) inserted between the second (intermediate) and third (lateral) cuneiform bones.
Figure 27. Time course of the changes in BBB (A), FSA (B), RHI (C), CLS (D), amplitude of H-wave (E) and M-wave (F) in the 2 x WBV group (depicted by the dotted line) as compared to the No-WBV-group (SCI, but no WBV) shown by the continuous line. Shown are group mean values ± S.D. Seven animals were used as intact controls and the remaining 12 were randomised into two groups, each consisting of 6 rats.
Figure 28. Representative longitudinal sections from the thoracic spinal cord at the level of Th7-Th9. The erythrocyte filled capillaries are clearly visible. In intact rats (A), the dense capillary network is located mainly in the grey matter (delineated from the white matter by small empty arrows). In No-WBV-animals (B) and rats subjected to WBV 2 times a day (C) the capillaries were equaly distributed throughout grey and white matter. Large empty arrows show the spinal leptomeningeal coverings.
Figure 29. Fraction areas (in %) of functioning capillaries (identified by the presence of erythrocytes in them) within the lesion site and in the lumbar intumescence at 12 weeks after compressive SCI. Shown are group mean values ± S.D. (N = 7 rats in the intact group, 6 rats in No-WBV, 6 rats in 2 X WBV). * indicates significant difference (p < 0,001) from the intact group; # indicates difference (p < 0,001) from the lesioned, but not the WBV-treated group. Shown are group mean values ± S.D. Seven animals were used as intact controls and the remaining 12 were randomised into two groups, each consisting of 6 rats.
Project Nr. 5: Changes in the musculoskeletal system after experimental compressive spinal cord injury and whole body vibration in rats
Participants: Alisa Schwarz, Carina Pick, Rachida Harrach, Gregor Stein, Habib Bendella, Ozlem Ozsoy, Umut Ozsoy, Eckhard Schoenau, Patrick Jaminet, Levent Sarikcioglu, Sarah A. Dunlop, Doychin N. Angelov
Traumatic spinal cord injury (SCI) causes a loss of locomotor function with associated compromise of the musculo-skeletal system. Whole body vibration (WBV) is a potential therapy following SCI, but little is known about its effects on the musculo-skeletal system. Following conditioning (Fig. 30 A, B), we examined locomotor recovery and the muskulo-skeletal system after thoracic (T7-9) compression SCI in adult rats. Daily WBV (Fig. 30 C) was started at 1, 7, 14 and 28 days after injury (WBV1-WBV28 respectively) and continued over a 12-week post-injury period. Intact rats, rats with SCI but no WBV (sham-treated) and a group that received passive flexion and extension (PFE) of their hind limbs served as controls (Fig. 30 D, E). Compared to sham-treated rats, neither WBV nor PFE improved motor function. Only WBV14 and PFE improved bdy support (Fig. 31). In line with earlier studies we failed to detect signs of soleus muscle atrophy (weight, cross sectional diameter, total amount of fibers, mean fiber diameter) (Fig. 32, 33) or bone loss in the femur (length, weight, bone mineral density) (Fig. 34, 35). One possible explanation is that, despite of injury extent, the preservation of some axons in the white matter, in combination with quadripedal locomotion, may provide sufficient trophic and neuronal support for the musculoskeletal system.
1 /
6
Figure 30. Conditioning of the rats was performed daily over two weeks before SCI. A: Walking on a wooden beam. B: Climbing on an inclined ladder. C: Setup of the rat Galileo-device for whole-body vibration (WBV) training: during conditioning intact rats received WBV at 15 Hz for 5 minutes daily. D, E: Passive flexion and extension (PFE) of the hind limbs during manual therapy.
Figure 31. Graphical representation of the changes in RHI (in time course) in the 6 treated groups (WBV1, WBV7, WBV14, WBV28, PFE) depicted by the red lines as compared to the control group (SCI, but no WBV) shown by the black lines. Shown are group mean values ± S.E., N = 10 rats per group.
Figure 32. Following perfusion fixation the left soleus was gently removed (A), dried and weighed. Thereafter it was placed into a rat brain matrix (World Precision Instruments) and a 4 mm thick transverse slice through its widest part was dissected free (B) . Each muscle slice was cut into 25 µm thick transverse sections and every 10th section was stained with hematoxylin-eosin (at least 10 sections per animal). Photographs at magnification x2,5 to determine the entire cross-sectional area and the number of its fibers (C) and at magnification x40 to determine the mean fiber diameter (D) followed.
Figure 33. Graphical representation of muscle weight (A), muscle diameter (B), mean number of muscle fibers (C) and mean fiber diameter (D) in the soleus muscle of the intact and in the 6 experimental groups of rats (No WBV, WBV1, WBV7, WBV14, WBV28, PFE). Regardless of spinal cord compression and postlesional treatments, at 12 weeks after SCI, most values were not changed when compared to those obtained for intact rats. The only difference detected was the smaller mean diameter of the soleus muscle in groups WBV28 and PFE (indicated by asterisks). Shown are group mean values ± S.E., N = 10 rats per group.
Figure 34. Photographing, weighing and length measurements of the right femora (A) were followed by X-ray analysis (B) and densitometry (C). After embedding in one-component metha-acrylate-based resin (Technovit 7200 VLC, Kulzer) femora were sectioned in the middle of the bone and thin ground sections (40 µm thick) were produced. The bones were not decalcified, which allows a better distinction between mineralized bone and unmineralized osteoid. Femoral length, weight, total-, corticalis portions-, and medullary cavity diameters were measured in intact (D) as well as in SCI-lesioned rats (E).
Figure 35. Observations through the polarisation filter BX-POL (Olympus) allow better distinction between mineralized bone and unmineralized osteoid. Representative pictures of cross-sections through the right femur depicting small bone appositions (A), large appositions especially on the anterior-medial and postero-lateral surface (B), equally dispensed appositions surrounding the whole bone or large parts of the bone (C) and no appositions of bone mass (D).
Project Nr. 6: Whole body vibration (WBV) following spinal cord injury (SCI) in rats: timing of intervention
Participants: Marilena Manthou, Diana Abdulla, Stoyan Pavlov, Ramona Jansen, Habib Bendella, Klaus Nohroudi, Gregor Stein, Carolin Meyer, Ozlem Ozsoy, Umut Ozsoy, Jasemin Behram Kandemir, Levent Sarikcioglu, Oliver Semler, Eckhard Schoenau, Sarah A Dunlop, Doychin N Angelov
Following spinal cord injury (SCI), exercise training provides a wide range of benefits and promotes activity-dependent synaptic plasticity. Whole body vibration (WBV) in SCI patients improves walking and spasticity as well as bone and muscle mass. However, little is known about the effects of timing or frequency of intervention. The aim of this project is to determine which WBV-onset improves locomotor and bladder functions and influences synaptic plasticity beneficially. SCI was followed by WBV starting 1, 7, 14, 28 days after injury (WBV1, WBV7, etc.) and continued for 12 weeks. Intact animals and those receiving SCI but no WBV (No WBV), SCI plus WBV twice daily (2 x WBV) and SCI followed by passive hindlimb flexion-extension (PFE) served as controls. Locomotor [BBB rating, foot stepping angle (FSA) and rump-height index (RHI)] as well as bladder function were determined at 1, 3, 6, 9, and 12 weeks. Following perfusion fixation at 12 weeks, lesion volume (Fig. 36) and immunofluorescence for astrogliosis (GFAP), microglia (IBA1) and synaptic vesicles (synaptophysin, SYN) were determined. Compared to the No WBV group, the WB7 and WBV14 groups showed significantly faster speeds of BBB score recovery though this effect was temporary (Fig. 37, 38). Treatment type did not significantly affect the changes in the FSA: the observed changes in the different treatment groups were similar and the estimated differences were not significantly different from 0 (Fig. 39, 40). Considering RHI we detected a sustained improvement in the WBV14 and PFE groups (Fig. 41, 42). Bladder function was better in the WBV14, WBV28, 2 x WBV and PFE groups (Fig. 43). Synaptophysin levels improved in response to WBV7 and WBV14, but worsened after WBV28 in parallel to an increased IBA1 and GFAP expression (Fig. 44, 45, 46). Correlation- and principal components analysis revealed complex relationships between behavioural (BBB, FSA, RHI) and morphological (GFAP, SYN) measurements. We conclude that WBV started 14 days after SCI provides the most benefit (RHI, bladder); starting at 1day after SCI provides no benefit and starting at 28 days may be detrimental. Increasing the intensity of WBV to twice daily did not provide additional benefit.
1 /
11
Figure 36. A: The lesioned portion (open arrow) of the spinal cord between vertebrae T7-T9 at 12 weeks following spinal cord compression. To ensure identical tissue sampling in all rats, we resected a 3 mm thick slice (between both solid lines) from the widest part of the lumbar enlargement, which was 3 mm below the 13th rib (dashed line). B: Following Cresyl violet staining of 25-µm longitudinal cryosections, lesion volume was estimated from spaced-serial sections using the Cavalieri principle. C: Lesion volume at 12 weeks after SCI in the 6 experimental groups WBV1 (N = 6), WBV7 (N = 7), WBV14 (N = 6), WBV28 (N = 5), 2 x WBV /N = 6) and PFE (N = 8). Data are group mean values ± S.D. There were no significant differences between groups (p > 0.05, one-way ANOVA).
Figure 37. Changes in the BBB scores over 12 weeks in 6 experimental groups compared to No WBV.WBV1 (N = 9), WBV7 (N = 8), WBV14 (N = 9), WBV28 (N = 5), 2 x WBV /N = 7) and PFE (N = 6) are represented by solid lines, and the untreated control group No WBV (N = 8) is represented by dashed lines. Data are group mean values ± S.D. and analysed using ANOVA. There were no significant differences between groups (p > 0.05, one-way ANOVA).
Figure 38. Changes in speed of (acceleration / deceleration) recovery for the BBB score in the 7 experimental groups over 12 weeks. The x-axis shows number of weeks after SCI at which BBB scores were assessed. The y-axis represents the speed of recovery in points/three weeks. Error bars indicate the 95% confidence interval of the estimate. WBV7 and WBV14 animals show initially faster recovery (steeper slopes) as compared to the untreated controls (No WBV) but this effect is temporary. In both the WBV7 and WBV14 groups, the number of points gained per three weeks reaches zero (crosses the 0 line)at ~ 8 weeks in the WBV7 and ~ 9 weeks in WBV14 animals) as compared to the No WBV group (~ 12 weeks). The speeds of recovery in the PFE and WBV28 groups have a low slope and are close to 0, indicating a lack of recovery.
Figure 39. Changes in foot-stepping angle (FSA) over 12 weeks in 6 experimental groups compared to No WBV. WBV1 (N = 9), WBV7 (N = 8), WBV14 (N = 9), WBV28 (N = 5), 2 x WBV /N = 7) and PFE (N = 6) are represented by solid lines and the untreated control group No WBV (N = 8) is represented by dashed lines. Data are group mean values ± S.D and analysed using ANOVA. There were no significant differences between groups (p > 0.05, one-way ANOVA).
Figure 40. Changes in speed of recovery for FSA in 7 experimental groups examined over 12 weeks. The x-axis shows number of weeks after SCI at which FSA was assessed. The y-axis represents the speed of recovery in points/three weeks. Error bars indicate the 95% confidence interval of the estimate. As the foot stepping is improved FSA decreases, which explains the ascending slopes of the recovery speeds. There were no significant differences between groups in the dynamics of the speed of recovery in FSA.
Figure 41. Changes in the RHI over 12 weeks in 6 experimental groups compared to No WBV. WBV1 (N = 9), WBV7 (N = 8), WBV14 (N = 9), WBV28 (N = 5), 2 x WBV /N = 7) and PFE (N = 8) are represented by solid lines and the untreated control group No WBV (N = 8) is represented by dashed lines. Data are group mean values ± S.D. and analysed using ANOVA. Significant differences * (p < 0,05) were seen between the No WBV group and the WBV14 and PFE groups.
Figure 42. Changes in the speed of recovery of RHI in the 7 experimental groups over 12 weeks. The x-axis shows number of weeks after SCI at which FSA was assessed. The y-axis represents the speed of recovery in points/three weeks. Error bars indicate the 95% confidence interval of the estimate. Compared to the No WBV group, the PFE group was the only one to show significantly faster recovery.
Figure 43. Changes in bladder score over 12 weeks in 5 experimental groups compared to No WBV. WBV7 (N = 8), WBV14 (N = 9), WBV28 (N = 5), 2 x WBV / day (N = 7) and PFE (N = 6) are represented by dotted lines, and the untreated control group No WBV (N = 8) represented by dashed lines. Data are group median values and error bars indicate interquartile range. There were significant differences (* p < 0,05) between the NO WBV group and the WBV14, 2 x WBV14, WBV28 and PFE groups.
Figure 44. A: Selected areas of interest (AOI, white dashed line) included perisomatic- and neuropil localization of synaptophysin immunofluorescence in the ventral horn. Representative image from an intact rat (counterstained with NeuroTrace 500/525 fluorescent green). B: Synaptic density in the lumbar spinal cord at 12 weeks after SCI. Mean number of synaptophysin-positive pixels ± SD per AOI in intact rats and in rats at 12 weeks after the different protocols (Intact, No WBV, WBV1, WBV7, WBV14, WBV28, PFE). When compared to No WBV, the WBV7 and WBV14 groups showed significantly increased density, indicated by asterisks (WBV14 did not differ from intact). By contrast, synaptic density in the WBV28 group was significantly lower than that in No WBV ((* p < 0,05).
Figure 45. Selected areas of interest (AOI, white dashed line) included Iba1-immunofluorescent microglia/macrophages in the ventral horn. Representative image from an intact rat (counterstained with NeuroTrace 500/525 fluorescent green). B:Iba1- immunofluorescence per AOI in intact rats as well as in rats at 12 weeks after different protocols (Intact, No WBV, WBV7, WBV14, WBV28, PFE). Iba1 immunoreactivity was significantly greater in the WBV28 group compared to No WBV (* p < 0.05) and WBV14 (**p < 0,05).
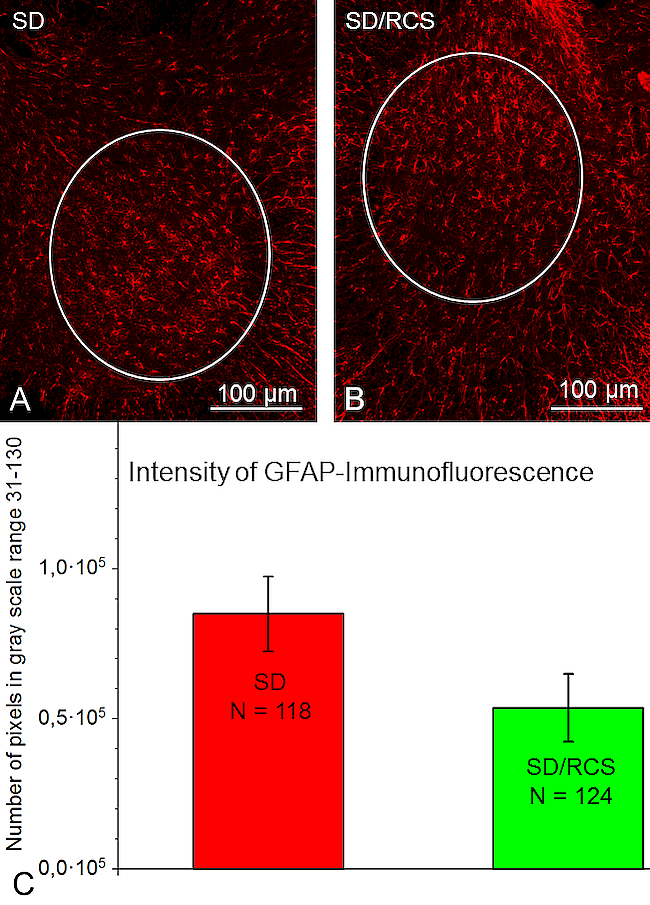
Figure 46. A: Selected areas of interest (AOI, white dashed line) included neuropil localization of GFAP in the ventral horn. Representative image from the WBV14 group (counterstained with NeuroTrace 500/525 fluorescent green). B:Total amount of GFAP- immunofluorescenceper AOI in intact rats and in rats at 12 weeks after the different WBV protocols (, No WBV, WBV1, WBV7, WBV14, WBV28). The selected gray scale range was 105-204. In comparison to intact rats, the increase in GFAP immunoreactivity was evident. There were no significant differences between groups(p > 0.05, one-way ANOVA).
Projekt 7: The effect of myelotomy following low thoracic spinal cord compression injury in rats
Participants: Carolin Meyer, Habib Bendella, Svenja Rink, Robin Gensch, Robert Seitz, Gregor Stein, Marilena Manthou, Theodora Papamitsou, Makoto Nakamura, Bertil Bouillon, Mary Galea, Peter Batchelor P, Sarah A Dunlop, Doychin N Angelov.
Myelotomy is a surgical procedure allowing removal of extravasated blood and necrotic tissue (Fig. 47) that is thought to attenuate secondary injury as well as promote recovery in experimental spinal cord injury (SCI) models and humans. Here we examined in rat whether myelotomy at 48h after low-thoracic compressive SCI provided any benefit over a 12 week period. Compared to animals receiving SCI alone, myelotomy worsened BBB scores (p<0.05) and also did not improve plantar stepping, ladder climbing, urinary bladder voiding or sensory function (thermal latency) during the 12-week period (Figs. 48, 49). Quantitative analyses of tissue sections at 12 weeks showed that myelotomy also did not reduce lesion volume nor alter immunohistochemical markers of axons in spared white matter bridges, microglia, astrocytes or serotinergic fibres. However, myelotomy reduced synaptophysin expression, a marker of synaptic plasticity (Figs. 50-53). We conclude that further studies are required to evaluate myelotomy after SCI.
1 /
7
Großansicht: Figure 47Figure 47 A-C: Myelotomy A: Longitudinal opening of the dorsal aspect of dura mater spinalis using a small scalpel. B: Using a blunt probe (0.2 mm in diameter) the dural incision was carefully widened and the spinal cord was gently detached from the underlying arachnoid. C: Blood clots and necrotic tissue were removed by aspiration with a plastic blunt canule.
Großansicht: Figure 48Figure 48 A-E: Functional measures A: BBB motor scores; B: foot stepping angle (FSA) in degrees;C: rump height index; D: number of correct ladder steps and E: bladder score (BS). Time 0 refers to pre-injury, i.e. intact normal, values. Values are means ± standard deviation. Other abbreviations are as in Table 1. Comparative analyses of the functional assessment were performed using Sigma Plot software. Differences with the selected level of statistical significance (p ≤ 0,05) are indicated by *.
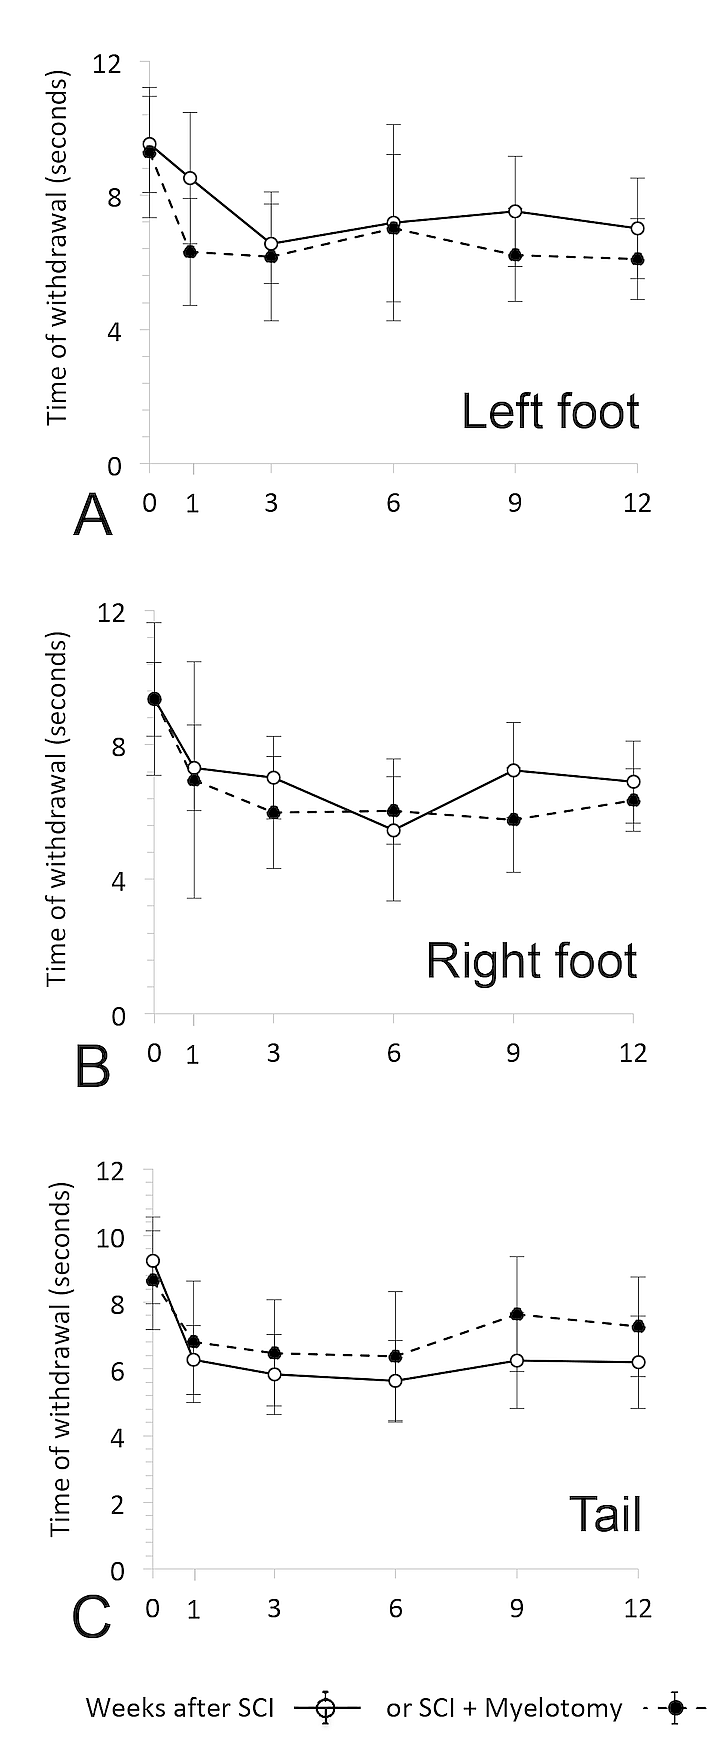
Großansicht: Figure 49 A-C: Thermal sensitivity for the right foot (A), left foot (B) and tail (C). Time 0 refers to pre-injury, i.e. intact normal, values. Values (time in seconds) are means ± standard deviation. Other abbreviations are as in Table 1.
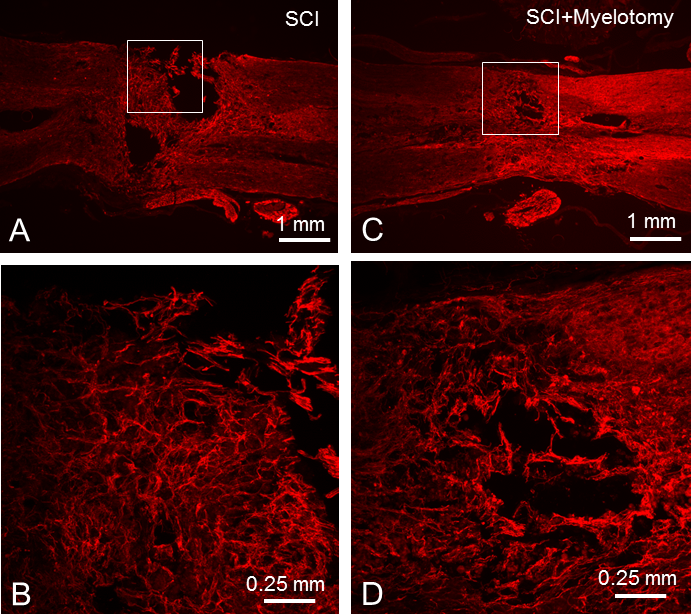
Großansicht: Figure 50Figure 50 A-C: Anatomical findings A: Representative dissected spinal cords from the two experimental groups. The lesion site can be clearly identified, particularly in the SCI group. Evidence of bleeding (brown colouration) at the injury site was seen following myelotomy (SCI+Myelotomy). B & C: longitudinal sections through the lesion site showing cavitation. Parenchymal bleeding (brown colouration) was apparent in the SCI+Myelotomy group.
Großansicht: Figure 51 A-D: Immunohistochemistry A & C: Anti-Neuronal class III -tubulin staining of longitudinal sections in the two groups. Boxes indicate site of high power images in B & D: Since there were no differences in immunointensity between groups, representative examples are shown. Abbreviations are as in Table 1.
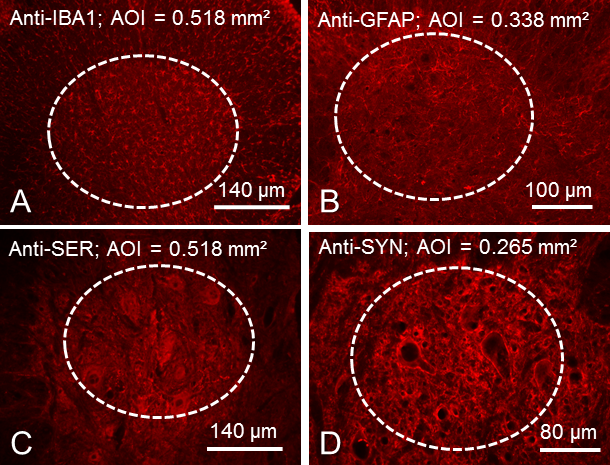
Großansicht: Figure 52 A-D: Immunohistochemistry in 25 µm thick transverse sections through the spinal cord below the level of compressive injury: a 3mm thick segment from the widest part of the lumbar enlargement, 3.0 mm below the 13th rib. Dash-lined ovals indicate the AOIs positioned over the ventral horn. A: Anti-IBA1 (microglia); B: anti-GFAP (astrocytes); C: anti-SER (serotinergic fibres) and D: anti-SYN (synaptophysin). Since there were no differences between groups, representative examples are shown: Sections in A and D stem from rats with SCI and sections in B and C – from rats with SCI+Myelotomy.
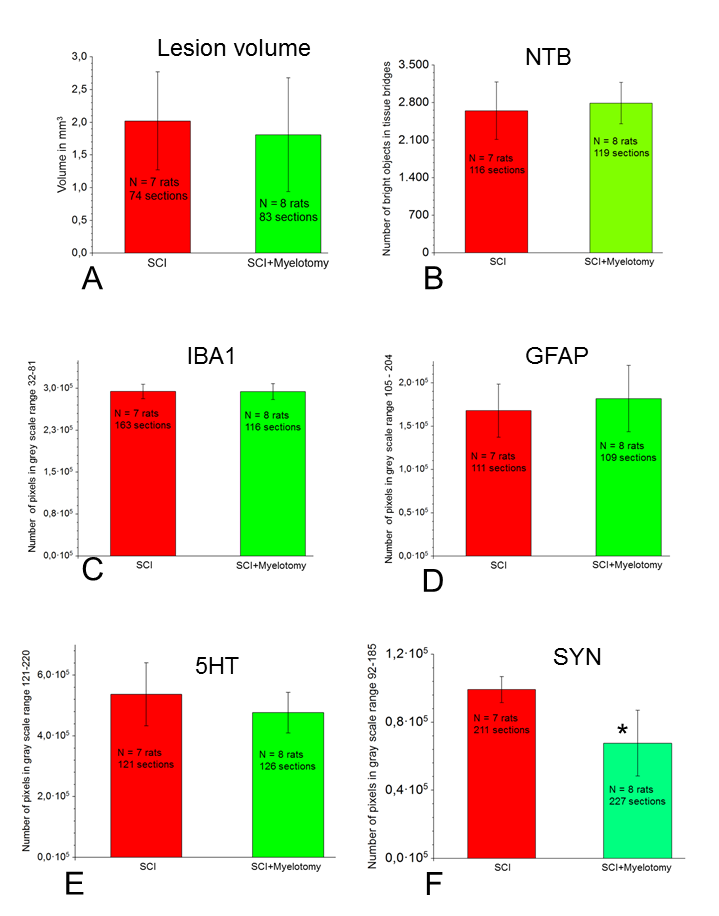
Großansicht: Figure 53 A-F: Quantitative analysis Values for each outcome are means ± standard deviation. A & B: Data derived from longitudinal sections. A: Lesion volume calculated from cresly-stained sections; B: Numbers of neurotubulin-positive axons in spared white matter bridges. C-F: Data derived from transverse sections below the injury-site. Labels are as in Figure 6. Comparisons between both groups of data for lesion volume and intensity of neurotubulin immunofluorescence, as well as for IBA1-, GFAP-, 5HT-, and synaptophysin-immunofluorescence were performed using Sigma Plot software. Differences with the selected level of statistical significance (p ≤ 0,05) are indicated by *.
Project Nr. 8: Constitutively reduced sensory capacity promotes better recovery after spinal cord-injury (SCI) in blind rats of the dystrophic RCS strain
Participants: SvenjaRink, Habib Bendella, Kurdin Alsolivany, Carolin Meyer, Aliona Woehler, Ramona Jansen, Zeynep Isik, Gregor Stein, Sina Wennmachers, Makoto Nakamura, Doychin N. Angelov
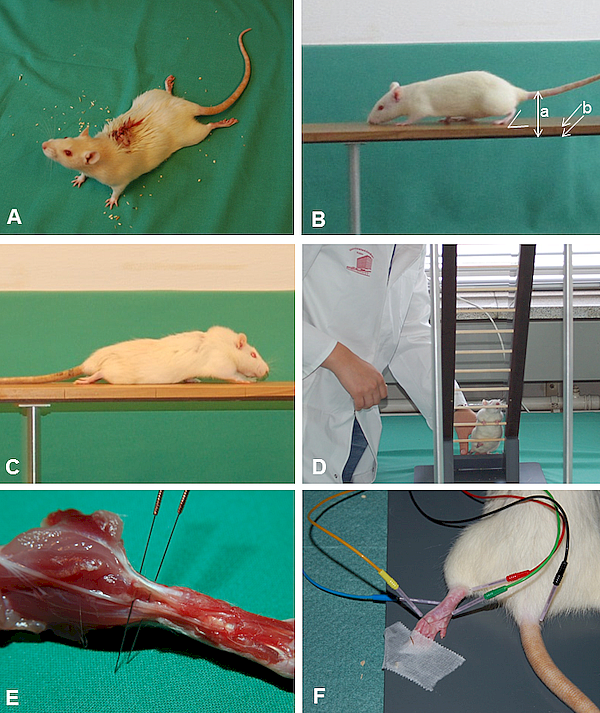
We compared functional, electrophysiological and morphological parameters after SCI in two groups of rats Sprague Dawley (SD) rats with normal vision and blind rats from a SD-substrain "Royal College of Surgeons" (SD/RCS) who lose their photoreceptor cells after birth due to a genetic defect in the retinal pigment epithelium. For these animals skin-, intramuscular-, and tendon receptors are major available means to resolve spatial information. The purpose of this project was to check whether increased sensitivity in SD/RCS rats would promote an improved recovery after SCI. Following conditioning (Fig. 54), all rats were subjected to severe compression of the spinal cord at vertebra Th8, spinal cord segment Th10 (Fig. 55). Recovery of locomotion was analyzed at 1, 3, 6, 9, and 12 weeks after SCI using video recordings of beam walking and inclined ladder climbing. Five functional parameters were studied: foot-stepping angle (FSA), rump-height index (RHI) estimating paw placement and body weight support, respectively, number of correct ladder steps (CLS) assessing skilled hindlimb movements, the BBB-locomotor score and an established urinary bladder score (BS) (Figs. 56 A-D). Sensitivity tests were followed by electrophysiological measurement of M- and H-wave amplitudes from contractions of the plantar musculature after stimulation of the tibial nerve (Fig. 56 E, F). The closing morphological measurements included lesion volume and expression of astro- and microglia below the lesion. Numerical assessments of BBB, FSA, BS, lesion volume and GFAP-expression revealed no significant differences between both strains. However, compared to SD-rats, the blind SD/RCS animals significantly improved RHI and CLS by 6 – 12 weeks after SCI. To our surprise the withdrawal latencies in the blind SD/RCS rats were longer and the amplitudes of M- and H-waves lower (Fig. 57, 58). The expression of IBA1-immunoreactivity in the lumbar enlargement was lower than in the SD-animals (Figs. 59, 60, 61). The longer withdrawal latencies suggest a decreased sensitivity in the blind SD/RCS rats, which promotes better recovery after SCI. In this way our results provide indirect support to earlier work showing, that hypersensitivity and chronic pain after contusive SCI impair the recovery of locomotor function.
1 /
8
Großansicht: Figure 54Figure 54: Conditioning of the rats was performed daily over two weeks before SCI. A: Walking on a wooden beam. B: Climbing on an inclined ladder. Adopted from Manthou et al. (2015). C: Sensitivity tests with the automated plantar "Anesthesiometer" (Ugo Basile Thermal Plantar™ Analgesia Instrument).
Großansicht: Figure 55: The self-made spinal cord compression device after Curtis et al. (1993). A: A stereotaxic frame with the device mounted on a metal plate. B: Driven by timed current, the drive pin of an electromagnet closes the forceps by pressing the moving blade of the forceps. Total closure is prevented by a limiting pin, which passes through a hole drilled in the stationary blade. A, B: adopted from Semler et al. (2011). C: Vertebral column and spinal cord of an animal fixed by perfusion. The lesioned portion of the spinal cord between vertebrae T7-T9 is indicated by the vertical lines. Exactly this portion of the spinal cord was removed and cut in longitudinal sections. D: A 25-µm longitudinal section of a rat spinal cord dissected 12 weeks after SCI. Cresyl violet staining. Note fluid-filled cavities occupying most of the area at the lesion site. Similar spaced-serial sections were used to estimate the lesion volume applying the Cavalieri principle. E: Determining the portion of spared white matter after SCI. A small sample of the spinal cord containing the lesion site was dissected free and embedded in Epon 812. F: Semithin sections stained with toluidine blue were used to determine the area of the vacuole and the entire area of the cord.
Großansicht: Figure 56: A: Locomotor functions were evaluated using the Basso, Beattie, Bresnahan (BBB) rating scale (Basso et al., 1995). Scoring was done by two independent investigators who watched video recordings at slow playback speed. Assessment was performed prior to injury (0 weeks) and 1, 3, 6, 9 and 12 weeks after SCI. B: Beam walking analysis of an intact rat. The foot-stepping angle (FSA) for the left hindpaw and the distances a (rump height) and b (beam width) used for calculation of the rump-height index (RHI = a / b) are drawn. C: A rat at 1 week after SCI walking on the platform towards its home cage. A, B, C: adopted from Manthou et al. (2015). D: Ladder climbing of a representative rat at 12 weeks after SCI: the animal is moving up using usually only its forepaws, the hindlimbs are hanging in front of or behind the rungs and do not support climbing. E: H-reflex recordings from the plantar musculature: demonstration of the exact anatomical positioning of the electrodes (cathode proximal, anode distal) in relation to the Achilles tendon of a sacrificed animal used for training. F: Distribution and insertion of electrodes during measurement (the cathode was red and always proximal; the anode was blue and always distal). A ground needle electrode (black) was applied at the base of the tail. During recording, a reference stainless steel electrode (green) was fixed to the skin between the first and second digit and an active recording electrode (yellow) inserted between the second (intermediate) and third (lateral) cuneiform bones. Adopted from Manthou et al. (2015).
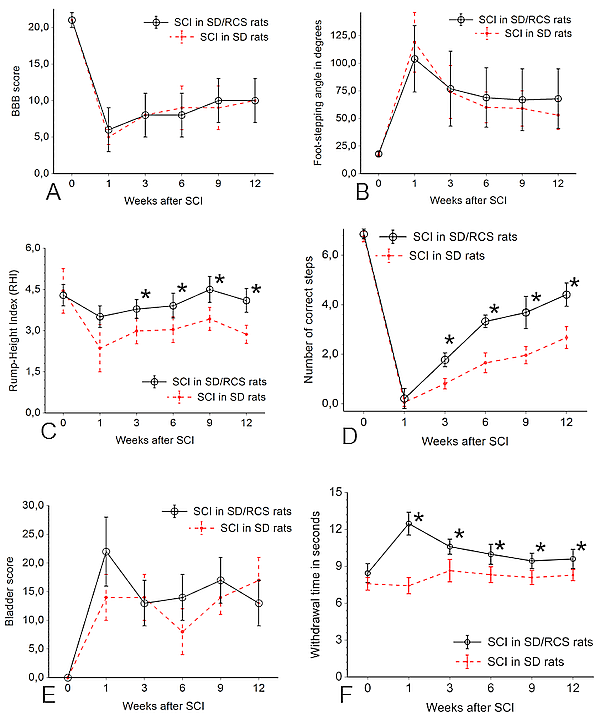
Großansicht: Figure 57: Time course of the changes in BBB (A), FSA (B), RHI (C), CLS (D), bladder score (E) and sensitivity (F) in the sighted SD group (depicted by the dotted line) as compared to the SD/RCS-group shown by the continuous line. Shown are group mean values S.D., N = 10 rats per group.
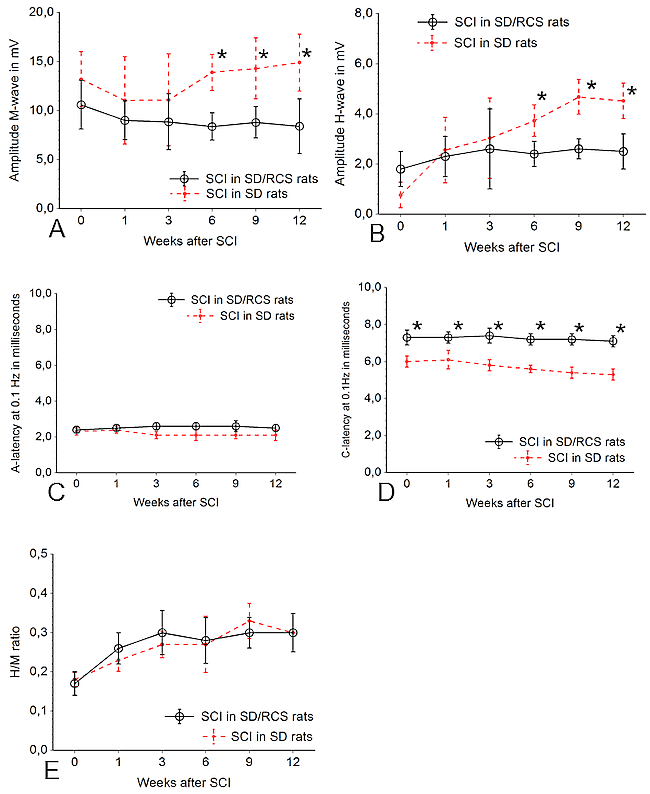
Großansicht: Figure 58: Time course of the changes in amplitude of H-wave (A), M-wave (B), A-latency (C) and C-latency (D) and in the sighted SD group (depicted by the dotted line) as compared to the SD/RCS-group shown by the continuous line. Shown are group mean values S.D., N = 10 rats per group.
Großansicht: Figure 59: Overview of the longitudinal sections through the lesion site of SD/RCS rats (A, C) and SD rats (B,D) after immunostaining with anti IBA1 plus anti-rabbit IgG conjugated with Cy3 for microglia (red cells in A, B) and with anti- GFAP plus anti-guinea pig IgG conjugated with Cy3 for astrocytes b>(red cells in C, D). 25 µm thick cryosections, counterstaining in green with NeuroTrace 500/525.
Großansicht: Figure 60: Selected areas of interest (AOI, white line) included IBA1-immunofluorescent microglia/macrophages in the ventral horn. Representative images from a SD- (A) and SD/RCS rat (B). C:: IBA1- immunofluorescence per AOI at 12 weeks after SCI was significantly greater in the SD group compared to SD/RCS (* p < 0.05).
Großansicht: Figure 61: Selected areas of interest (AOI, white line) included neuropil localization of GFAP in the ventral horn. Representative images from a SD- (A) and SD/RCS rat (B). C: Total amount of GFAP- immunofluorescence per AOI at 12 weeks after SCI. There were no significant differences between both groups (p > 0.05, one-way ANOVA).
Project Nr. 9: Recovery after spinal cord injury by modulation of the proteoglycan receptor PTPσ
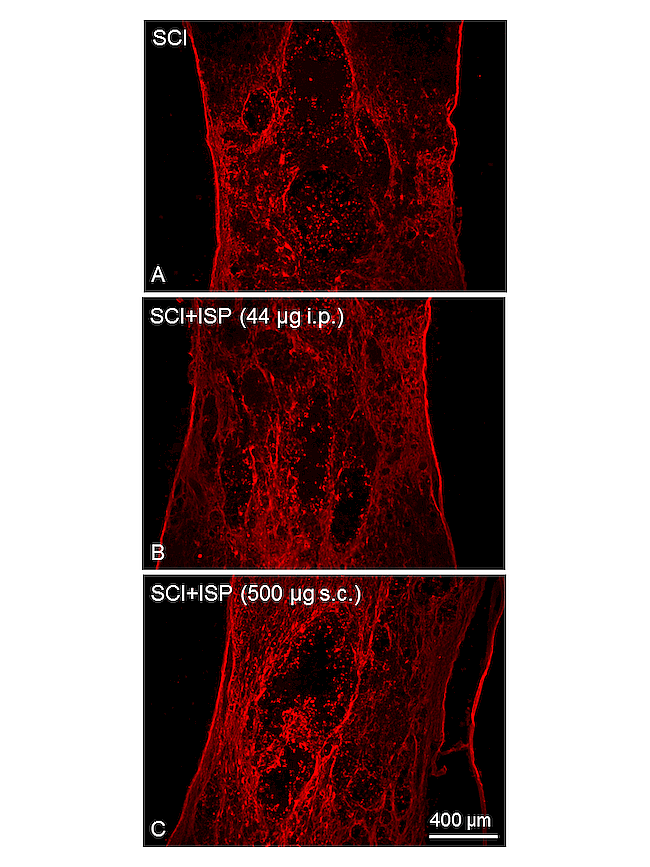
SCI is followed by dramatic upregulation of chondroitin sulfate proteoglycans (CSPGs) which limit axonal regeneration, oligodendrocyte replacement and remyelination. The recent discovery of the specific CSPGs signaling receptor protein tyrosine phosphatase sigma (RPTPσ) provided an opportunity to refine the therapeutic approach to overcome CSPGs inhibitory actions. In previously published work, subcutaneous (s.c.) delivery of 44 µg/day of a peptide mimetic of PTPσ called intracellular sigma peptide (ISP), which binds to PTPσ and blocks CSPG-mediated inhibition, facilitated recovery after contusive SCI. Since this result could be of great interest for clinical trials, we independently repeated this study, but modified the method of injury as well as peptide application and the dosage. Following SCI at the Th10-segment, 40 rats were distributed in 3 groups. Animals in group 1 (20 rats) were subjected to SCI, but received no treatment. Rats in group 2 were treated with intraperitoneal (i.p.) injections of 44 µg/day ISP (SCI+ISP44) and animals of group 3 with s.c. injections of 500 µg/day ISP (SCI+ISP500) for 7 weeks after lesioning. Recovery was analyzed at 1, 3, 6, 9 and 12 weeks after SCI by determining (i) BBB-score, (ii) foot-stepping angle, (iii) rump-height index, (iv) number of correct ladder steps, (v) bladder score and (vi) sensitivity (withdrawal latency after thermal stimulus) (Figs. 62, 63). Finally, we determined the amount of serotonergic fibers in the preserved neural tissue bridges (PNTB) around the lesion site (Figs. 64-66). Our results show that, systemic therapy with ISP improved locomotor, sensory and vegetative recovery which correlated with more spared serotonergic fibers in PNTB.
1 /
5
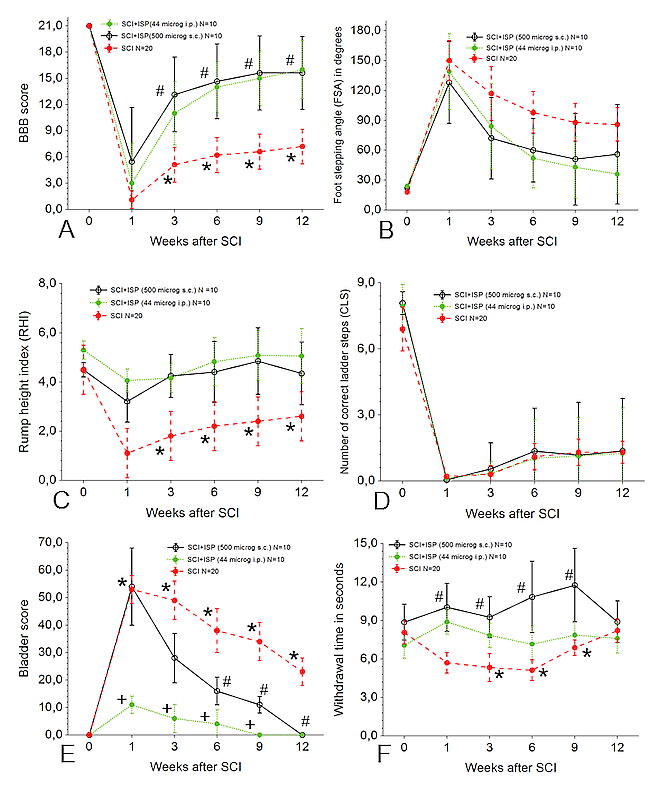
Großansicht: Time course of values for several functional parameters measured in "all rats". A: BBB motor scores; B: foot stepping angle (FSA) in degrees; C: rump height index; D: number of correct ladder steps and E: bladder score (BS); F: withdrawal time in seconds. Time 0 refers to pre-injury, i.e. intact normal, values. Values are means ± standard deviation. Comparative analyses of the functional assessment were performed using Sigma Plot software. Differences with the selected level of statistical significance (p ≤ 0,05) between group SCI and group SCI+ISP44 i.p. are indicated by *, between group SCI and group SCI+ISP500 s.c. by # and between groups SCI+ISP44 i.p. and group SCI+ISP500 s.c. by +.
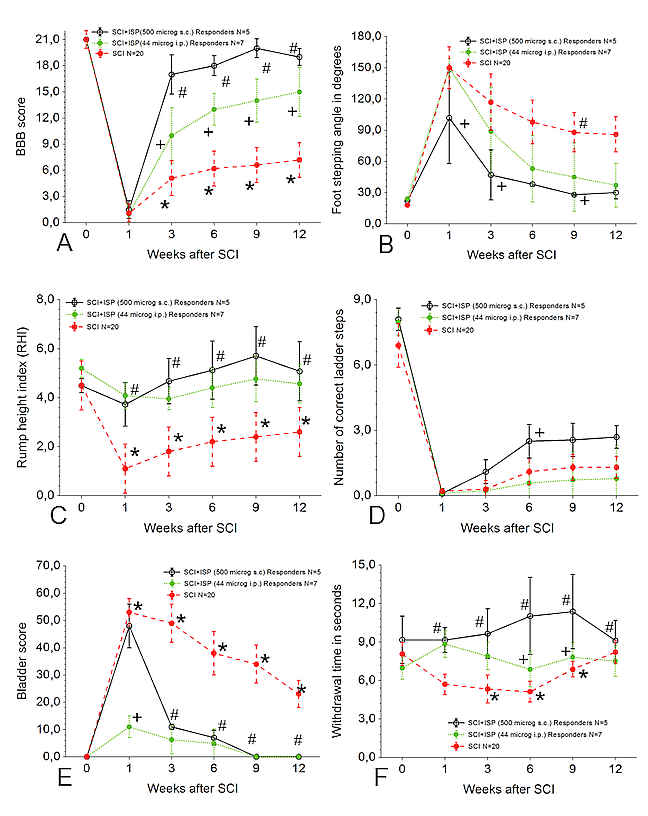
Großansicht: Figure 63: Time course of values for several functional parameters measured only in the "responders". A: BBB motor scores; B: foot stepping angle (FSA) in degrees; C: rump height index; D: number of correct ladder steps and E: bladder score (BS); F: withdrawal time in seconds. Time 0 refers to pre-injury, i.e. intact normal, values. Values are means ± standard deviation. Other abbreviations are as in Table 2. Comparative analyses of the functional assessment were performed using Sigma Plot software. Differences with the selected level of statistical significance (p ≤ 0,05) between group SCI and group SCI+ISP44 i.p. are indicated by *, between group SCI and group SCI+ISP500 s.c. by # and between groups SCI+ISP44 i.p. and group SCI+ISP500 s.c. by +.
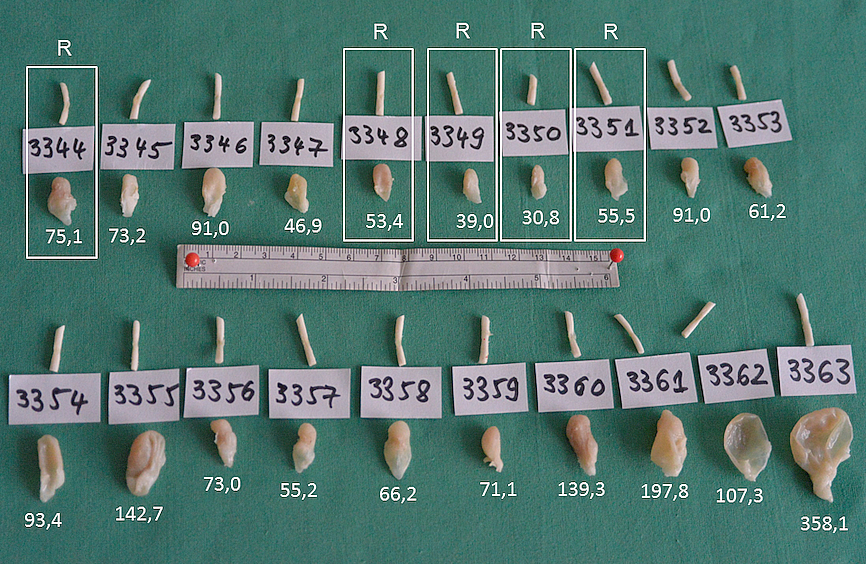
Großansicht: Figure 64: Spinal cords with the lesion site and urinary bladders of the SCI+ISP500 group (upper row) and the SCI group (lower row) at 12 weeks after injury. To keep the orientation of the spinal cord and sections from it, the caudal cut (approximately 5 mm below the lesion) was placed perpendicularly to the long axis of the cord; the rostral section (5 mm above the lesion) was positioned at a sharp angle of 45°. The mass of each urinary bladder is indicated in milligram. The spinal cords and bladders of the reponding rats have been framed and indicated with "R".
Großansicht: Figure 65: Fluorescent immunocytochemistry with anti-serotonin in representative frontal longitudinal sections (25 µm) through the spinal cord from the three groups. The lesion site with the cavitation can be clearly identified. Ten spaced serial sections, which "covered" the entire thickness on the spinal cord, were used to measure the intensity of serotonin-fluorescence.
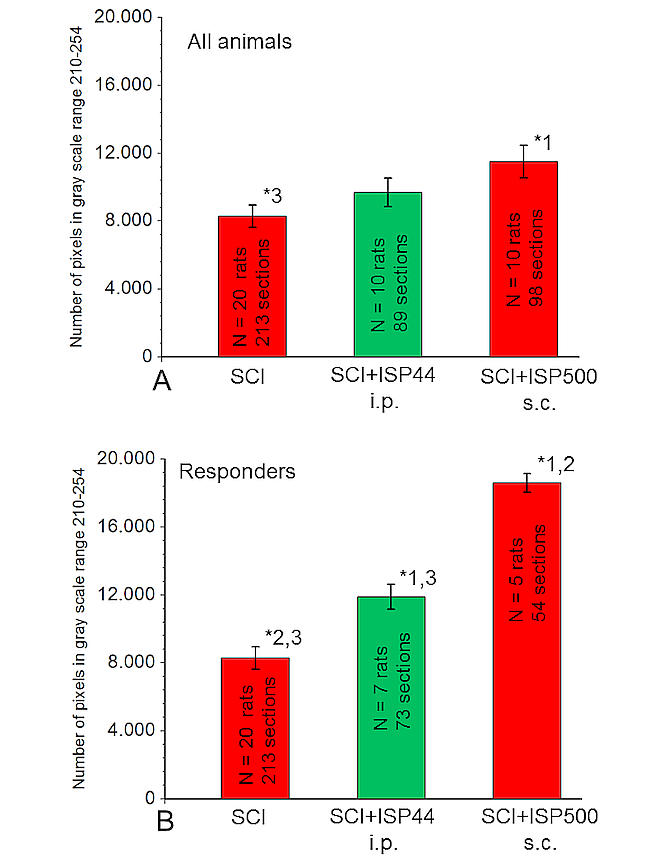
Großansicht: Figure 66: Quantitative analysis of the serotonin immunofluorescence (data derived from the longitudinal sections, s. Fig. 4). Values for each outcome are means ± standard deviation. A: Values for serotonin-positive objects in the preserved neural tissue bridges (PNTB) of "all animals". B: Values for serotonin-positive objects in PNTB of the "responders". Comparisons between the three groups of data were performed using Sigma Plot software. Differences with the selected level of statistical significance (p ≤ 0,05) are indicated by *. Numbers close to * indicate the different group, 1 = SCI, 2 = SCI+ISP44 i.p. and 3 = SCI+ISP500 s.c.
Project Nr. 10: Anatomic conditions for bypass surgery between rostral (T7-T9) and caudal (L2, L4, S1) ventral roots to treat paralysis after spinal cord injury
Participants: HabibBendella, Svenja Rink, Aliona Wöhler, Janna Feiser, Andre Wilden, Maria Grosheva, Hans-Jürgen Stoffels, Carolin Meyer, Marilena Manthou, Makoto Nakamura, Doychin N. Angelov
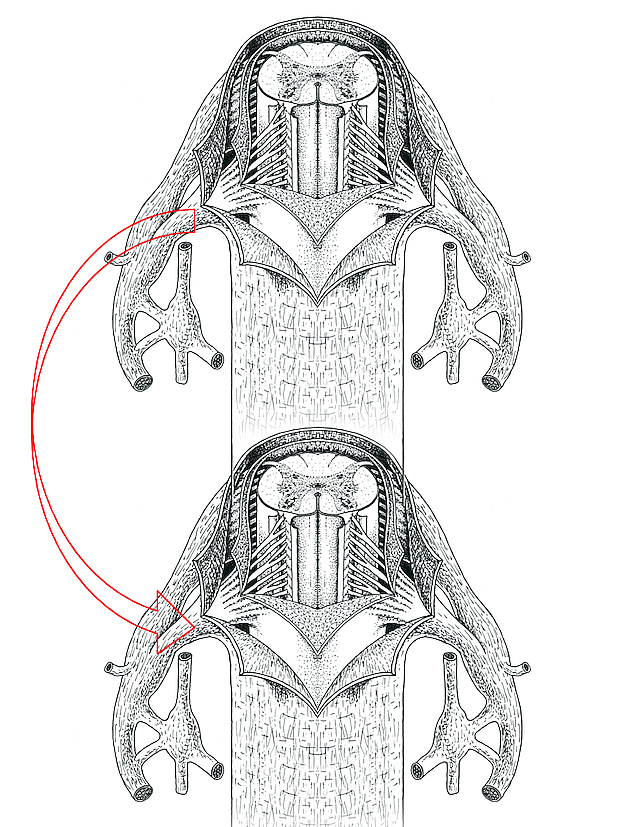
Severe spinal cord injuries cause permanent neurological deficits and are still considered as inaccessible to efficient therapy. Injured spinal cord axons are unable to spontaneously regenerate. Re-establishing functional activity especially in the lower limbs by reinnervation of the caudal infra-lesional territories might represent an effective therapeutic strategy. Numerous surgical neurotizations have been developed to bridge the spinal cord lesion site and connect the intact supra-lesional portions of the spinal cord to peripheral nerves (spinal nerves, intercostal nerves) and muscles. The major disadvantage of these techniques is the increased hypersensitivity, spasticity and pathologic pain in the spinal cord injured patients, which occur due to the vigorous sprouting of injured afferent sensory fibers after reconstructive surgery. Using micro-surgical instruments and an operation microscope we performed detailed anatomical preparation of the vertebral canal and its content in five human cadavers. Our observations allow us to put forward the possibility to develop a more precise surgical approach, the so called "ventral root bypass" that avoids lesion of the dorsal roots and eliminates sensitivity complications (Fig. 67). The proposed kind of neurotization has been neither used, nor put forward. The general opinion is that radix ventralis and radix dorsalis unite to form the spinal nerve inside the dural sac. This assumption is not accurate, because both radices leave the dural sac separately (Fig. 68). This neglected anatomical feature allows a reliable intravertebral exposure of the dura-mater ensheathed ventral roots and their damage-preventing end-to-side neurorrhaphy by interpositional nerve grafts (Figs. 69, 70).
1 /
4
Großansicht: Figure 67: Schematical drawing illustrationg the proposed bypass between the rostral and caudal ventral roots. Adapted from Krstic (1978) Tafel 174
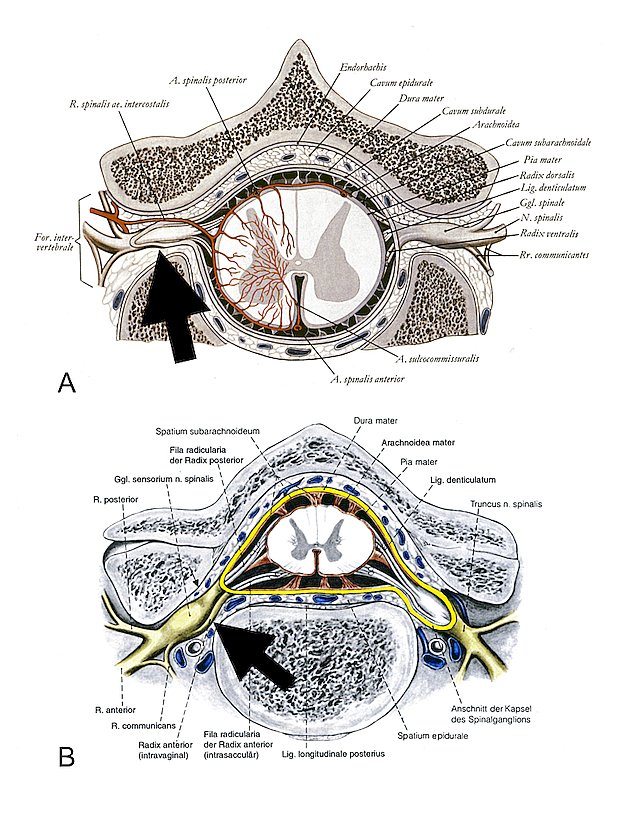
Großansicht: Figure 68: A: Schematical drawing of a cross section through the human spinal cord illustrating the intra-arachnoidal course of the ventral and dorsal roots and their intradural unification at the level of the intervertebral foramen (arrow). Note that the spinal ganglion has been cut tangentially so that its surface is deprived from dura mater spinalis. Adapted from Waldeyer and Mayet (1980). B: Similar drawing showing that the ventral and dorsal roots perforate dura mater spinalis separately before their unification at the level of the intervertebral foramen (arrow). Note that the spinal ganglion is intact and its surface is covered by dura mater. Adapted from Tillmann (1997).
Großansicht: Figure 69: A: Widely opened vertebral canal reveals the dorsal aspect of dura mater spinalis, the dorsal roots and the spinal ganglia (arrows). B: A slight displacement of the dorsal root by a blunt probe reveals the ventral root (arrow).
Großansicht: Figure 70: A: Following careful deep preparation under the microscope the entire dural sac (without the spinal ganglia) was removed from the vertebral canal. B: Inspection and photography of the specimen under the Olympus DP21 digital camera revealed the ventral root more clearly.
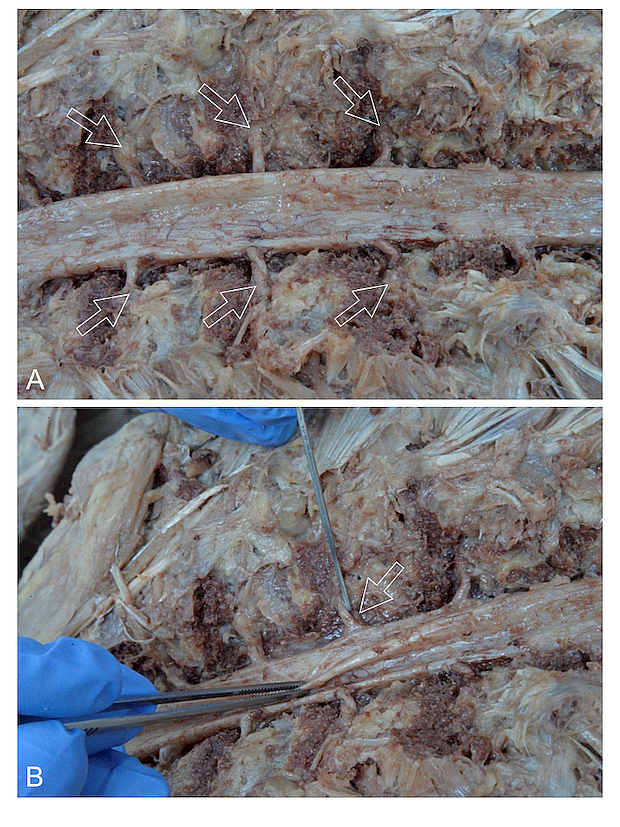
Project Nr. 11: Amount of axons in spared neural tissue bridges, but not their width or area, correlates with functional recovery in spinal cord-injured rats.
Participants: Svenja Rink, Stoyan Pavlov, Aliona Wöhler, Habib Bendella, Marilena Manthou, Theodora Papamitsou, Sarah A. Dunlop, Doychin N. Angelov
After spinal cord injury (SCI) the relationship between various parameters of tissue damage and subsequent functional recovery is not well understood: patients may regain micturition control and walking despite large post-injury medullar cavities. The objective of the present study was to establish possible correlations between morphological findings and degree of functional recovery after spinal cord compression at vertebra Th8 in rats. Recovery of motor (BBB, foot-stepping angle, rump-height index, ladder climbing), sensory (withdrawal latency) and bladder functions was analysed at 1, 3, 6, 9 and 12 weeks post SCI (Figs. 71, 22). Following perfusion f7xation, spinal cord tissue encompassing the injury site was cut in longitudinal frontal sections. Lesion length, lesion volume and area of the perilesional neural tissue bridges were determined after staining with cresyl violet. The amount of axons in these bridges was quantified after staining for class III b-tubulin (Fig. 73, 74). We found that it was not the area of the spared tissue bridges (that is routinely determined during magnetic resonance imaging, MRI), but the amount of axons in them which correlated with functional recovery Spearman's ρ > 0.8; p < 0.001 after SCI (Fig. 75) and conclude that prognostic statements based only on MRI-measurements should be considered with caution
1 /
5
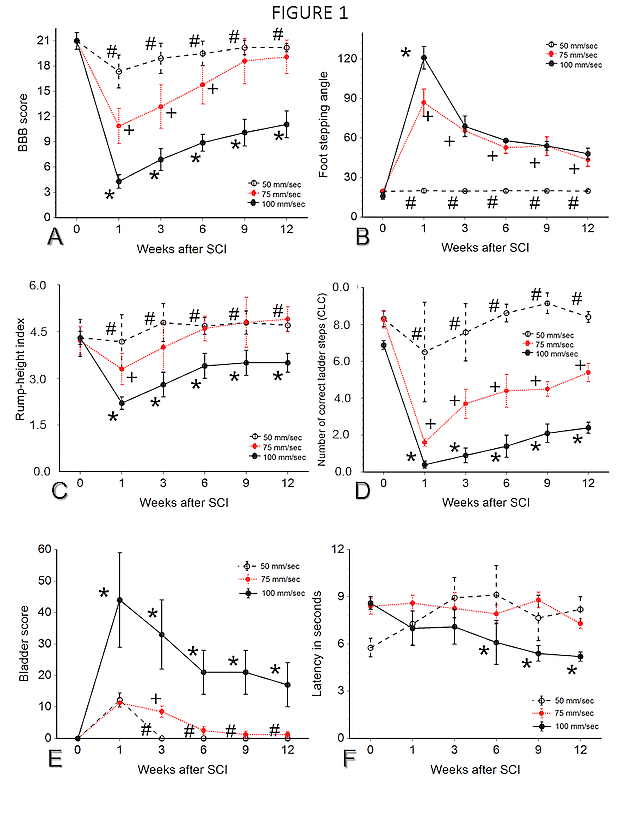
Großansicht: Figure 71 A-F: Time course of values for several functional parameters. A: BBB motor scores; B: foot stepping angle (FSA) in degrees; C: rump height index; D: number of correct ladder steps; E: bladder score (BS); F: withdrawal time in seconds. Time 0 refers to pre-injury, i.e. intact normal, values. Values are means ± standard deviation. Comparative analyses of the functional assessment were performed using Sigma Plot software. Differences with the selected level of statistical significance (p ≤ 0.05) between group 100 mm/sec (N = 12 rats) and group 75 mm/sec (N = 12 rats) are indicated by *, between group 100 mm/sec and group 50 mm/sec (N = 8 rats) by # and between groups 75 mm/sec and group 50 mm/sec by +.
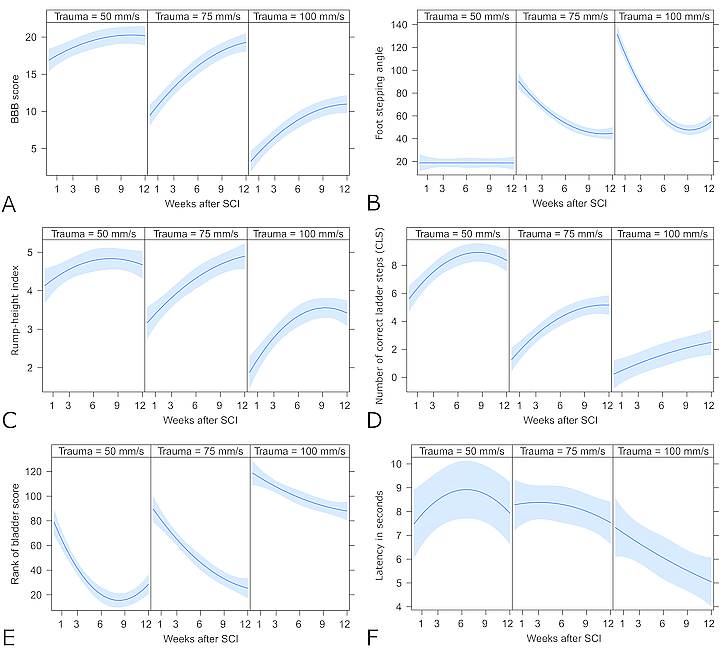
Großansicht: Figure 72 A-F: Effects of the velocity of SCI (50 mm/s, 75 mm/s or 100 mm/s) on the changes in the measured functional outcomes estimated by the mixed effects models. The shaded area indicates the 95% confidence interval of the estimates (blue line). The higher velocity of the injury leads to significantly worse intermediate and final results of the quantitative functional measurements BBB score (A), Foot stepping angle (B), Rump-height index (C) and Number of correct ladder steps (CLS; D). For BBB score (A) and CLS(B) this worsening is accompanied by decreased rate of recovery over time in the animals subjected to higher velocity injury. The rank of the Bladder score (E) was fitted to a non-parametric model, which includes the same covariates as the other models. The graph (E) shows the estimated change in rank of the ordinal bladder score over time. This outcome is not quantitative and should be interpreted only qualitatively, i.e. the bladder score is expected to decrease (improve) over time but the animals that were subjected to higher velocity injuries are more likely to have higher bladder scores and probably slower improvement over time. The estimated effects on the thermal sensitivity measured by the latency of withdrawal (F) are more obscure. The most severe injury at 100 mm/s leads to substantial reduction in latency of withdrawal (increased sensitivity) after the SCI and a continuous decrease over time. Perhaps these values represent hyper-sensitivity and/or pain. The wider confidence intervals indicate that large portion of the variance was not explained by the model, i.e. there could be other unknown factors influencing post-injury sensitivity.
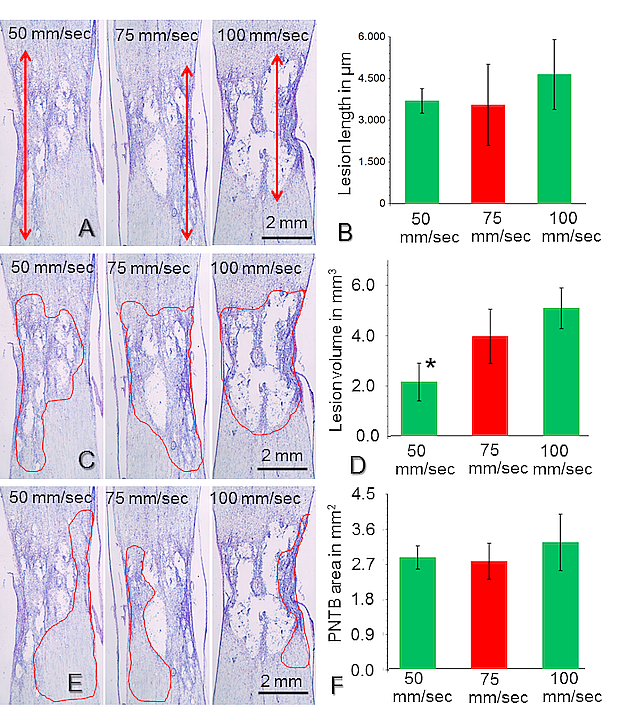
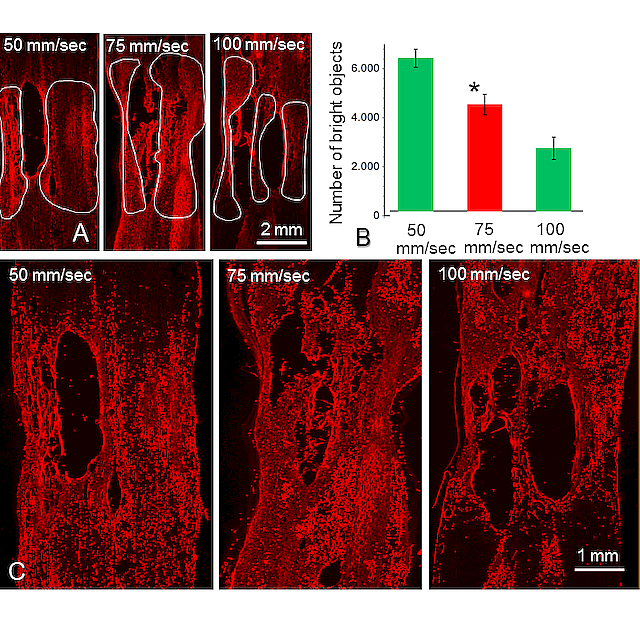
Großansicht: Figure 73 A-E: Anatomical measurements in frontal longitudinal sections (25 µm thick) through the spinal cord from the three groups. The lesion site with the cavitation can be clearly identified. Ten serially spaced sections, which "covered" the entire thickness on the spinal cord, were stained with cresylviolet (Nissl stain) and used to measure the mean lesion length (A), lesion volume (outlined cavity in C) and area of the preserved neural tissue bridges (outlined bridges in E). Quantitative estimates of the anatomical measurements. Values for each outcome are means ± standard deviation. There were no significant differences in the mean lesion length (B), lesion volume (D) and area of the preserved neural tissue bridges (E) as assessed from cresyl-stained sections.
Großansicht: Figure 74 A-C: Other sets of serially spaced sections were stained by immunofluorescence for neuronal class III -tubulin and used to determine the amount of neural tissue in spared perilesional tissue bridges (outlined in A). B: Quantifications after immunofluorescent staining for neuronal class III -tubulin, showed that the amount of neural tissue in the spared perilesional tissue bridges (number of bright objects) in the SCI-75 group (N = 12 rats) was significantly higher when compared to that in the SCI-100 group (N = 12 rats). C: The function "count number of bright objects” of the Image-Pro Plus Software, when applied to the images displayed in A, allowed to document images with relatively high-resolution profiles that were positive for anti-neuronal class III -tubulin.
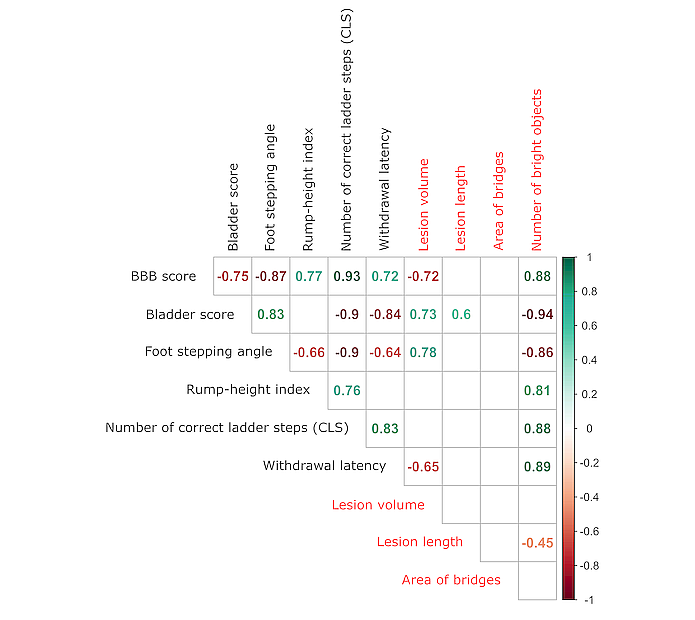
Großansicht: Figure 75: Multiple correlation matrix showing the Spearman’s indices for correlation between the cumulative scores of the functional measurements (black; see explanations in text) and the measures for morphological changes (red) in the spinal cord after injury regardless of the velocity of the trauma. Only significant (p≤0.05) indices are shown. The color of the index denotes the direction of association: green for positive correlation and red for negative. All functional measures are strongly correlated with each other, with the number of correct ladder steps (CLS) showing the highest correlation with all other functional outcomes. This is an indication that probably CLS can be used as a single measurement for the evaluation of the complex locomotor function after SCI. Of the morphological measurements, only the number of bright objects shows strong correlation (absolute value above 0.8) with function. Lesion volume also correlates with some of the functional measurements but interestingly not with the rump-height index and the CLS.
Project Nr. 12: Motor, sensitive, and vegetative recovery in rats with compressive spinal-cord injury after combined treatment with erythropoietin and whole-body vibration
Participants: Svenja Rink, Maria Eleni Manthou, Julia Arnold, Merle Grigo, Paulina Dicken, Diana Abdulla, Habib Bendella, Klaus Nohroudi, Doychin N. Angelov
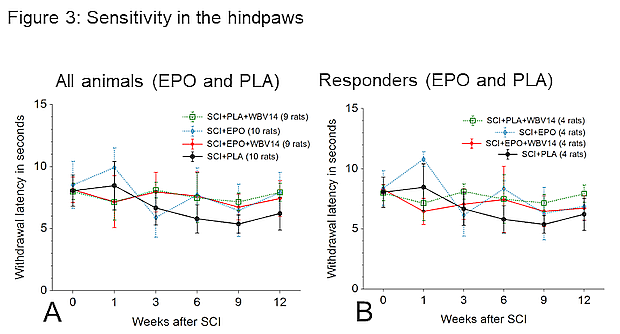
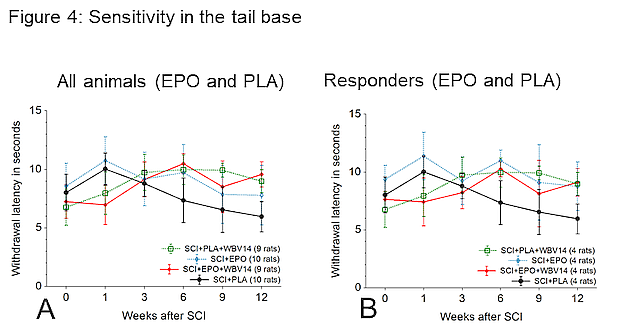
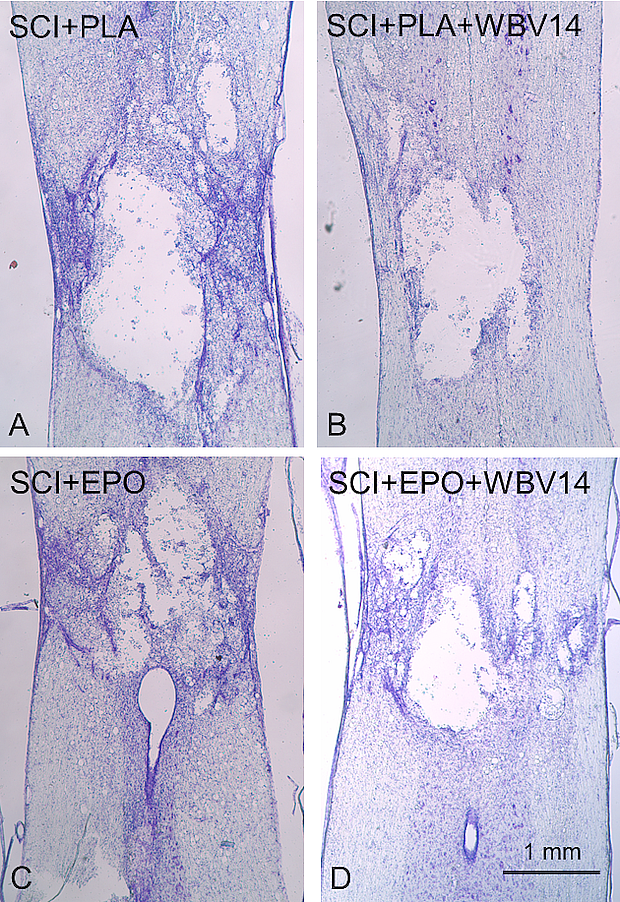
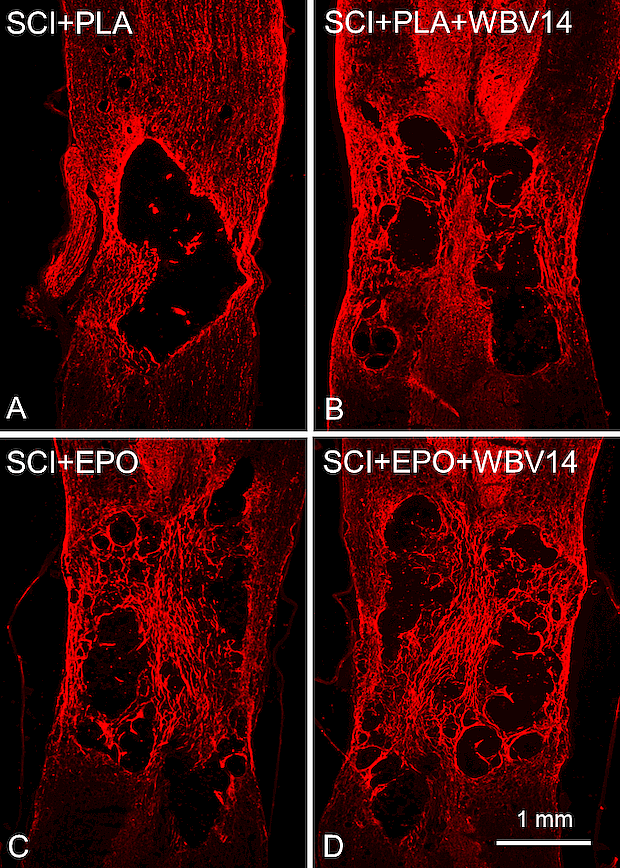
Physical therapy with whole body vibration (WBV) following compressive spinal cord injury (SCI) in rats restores density of perisomatic synapses, improves body weight support and leads to a better bladder function. The purpose of the study was to determine whether the combined treatment with WBV plus erythropoietin (EPO) would further improve motor, sensory and vegetative functions after SCI in rats. Severe compressive SCI at low thoracic level was followed by a single i.p. injection of 2,5 µg (250 IU) human recombinant EPO. Physical therapy with WBV started on 14th day after injury and continued over a 12-week post injury period. Locomotor recovery, sensitivity tests and urinary bladder scores were analysed at 1, 3, 6, 9, and 12 weeks after SCI. The closing morphological measurements included lesion volume and numbers of axons in the preserved perilesional neural tissue bridges (PNTB). Assessment of motor performance sensitivity and bladder function revealed no significant effects of EPO when compared to the control treatments (Figs. 76-79). EPO treatment neither reduced the lesion volume, nor increased the number of axons in PNTB (Figs. 80-81).
The combination of WBV+EPO exerts no positive effects on hind limbs motor performance and bladder function after compressive SCI in rats.
1 /
6
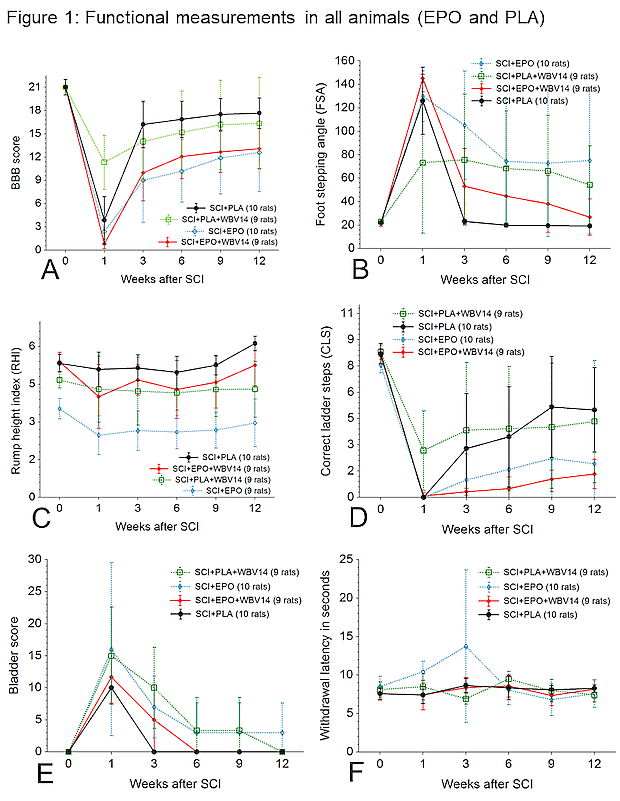
Figure 76: Time course of values for the 6 functional parameters measured in all 4 groups in "all rats". A: BBB motor scores; B: foot stepping angle (FSA) in degrees; C: rump height index; D: number of correct ladder steps; E: bladder score (BS) and F:: average withdrawal time (in seconds) measured in the hindpaws and tail-base. Time 0 refers to pre-injury, i.e. intact normal, values. Values are means ± standard deviation.
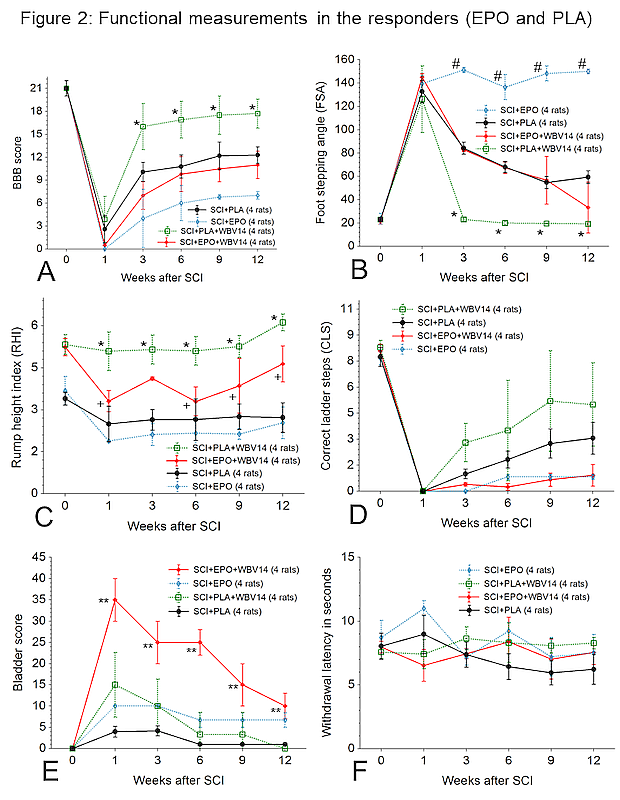
Figure 77: Time course of values for the 6 functional parameters measured only in the "responders". A: BBB motor scores; B: foot stepping angle (FSA) in degrees; C: rump height index; D: number of correct ladder steps; E: bladder score (BS) and F: withdrawal time in seconds. Time 0 refers to pre-injury, i.e. intact normal, values. Values are means ± standard deviation. Comparative analyses of the functional assessment were performed using Sigma Plot software. Differences with the selected level of statistical significance (p ≤ 0,05) between groups SCI+PLA+WBV14 and SCI+PLA, SCI+EPO+WBV14, SCI+EPO are indicated by*, between groups SCI+EPO and SCI+EPO+WBV14 and SCI+PLA by#, between groups SCI+EPO and SCI+EPO+WBV14 by+ and between groups SCI+EPO+WBV14 and SCI+PLA+WBV14, SC+EPO, SCI+PLA by **.
Figure 78: Time course of values for the functional parameter withdrawal after heat application to the hindpaws measured in all animals and in the "responders" in both EPO-treated groups (SCI+EPO and SCI+EPO+WBV14) which have been compared to the values from "responders" from the respective controls (SCI+PLA and SCI+PLA+WBV14). No significant differences could be detected.
Figure 79: Time course of values for the functional parameter withdrawal after heat application to the base of the tail measured in all animals and the "responders" in both EPO-treated groups (SCI+EPO and SCI+EPO+WBV14) which have been compared to the values from "responders" from the respective controls (SCI+PLA and SCI+PLA+WBV14). No significant differences could be detected.
Figure 80: Anatomical measurements in representative frontal longitudinal sections (25 µm thick) through the spinal cord from the four groups. The lesion site with the cavitation can be clearly identified. Ten serially spaced sections, which "covered" the entire thickness on the spinal cord, were stained with cresylviolet (Nissl stain) and used to measure the mean lesion volume.
Figure 81: Other sets of serially spaced sections were stained by immunofluorescence for neuronal class III ß-tubulin and used to determine the amount of neural tissue in spared perilesional tissue bridges.